Download top and best high-quality free Statistics PNG Transparent Images backgrounds available in various sizes. To view the full PNG size resolution click on any of the below image thumbnail.
License Info: Creative Commons 4.0 BY-NC
Statistics is the branch of mathematics that deals with collecting, organizing, analyzing, interpreting, and presenting data. It is customary to start with a statistical population or model to be investigated when applying statistics to a scientific, industrial, or social problem. Populations can include many people or things, such as “all individuals living in a country” or “every atom in a crystal.” Statistics is concerned with all aspects of data, including data collection planning in terms of survey and experiment design.
When census data is unavailable, statisticians use unique experiment designs and survey samples to obtain data. Representative sampling ensures that inferences and conclusions drawn from the sample may be extrapolated to the entire population. An experimental study is collecting measurements of the system under investigation, changing it, and then taking more measurements using the same technique to see if the modification has changed the measurements’ results. An observational study, on the other hand, does not entail any experimental modification.
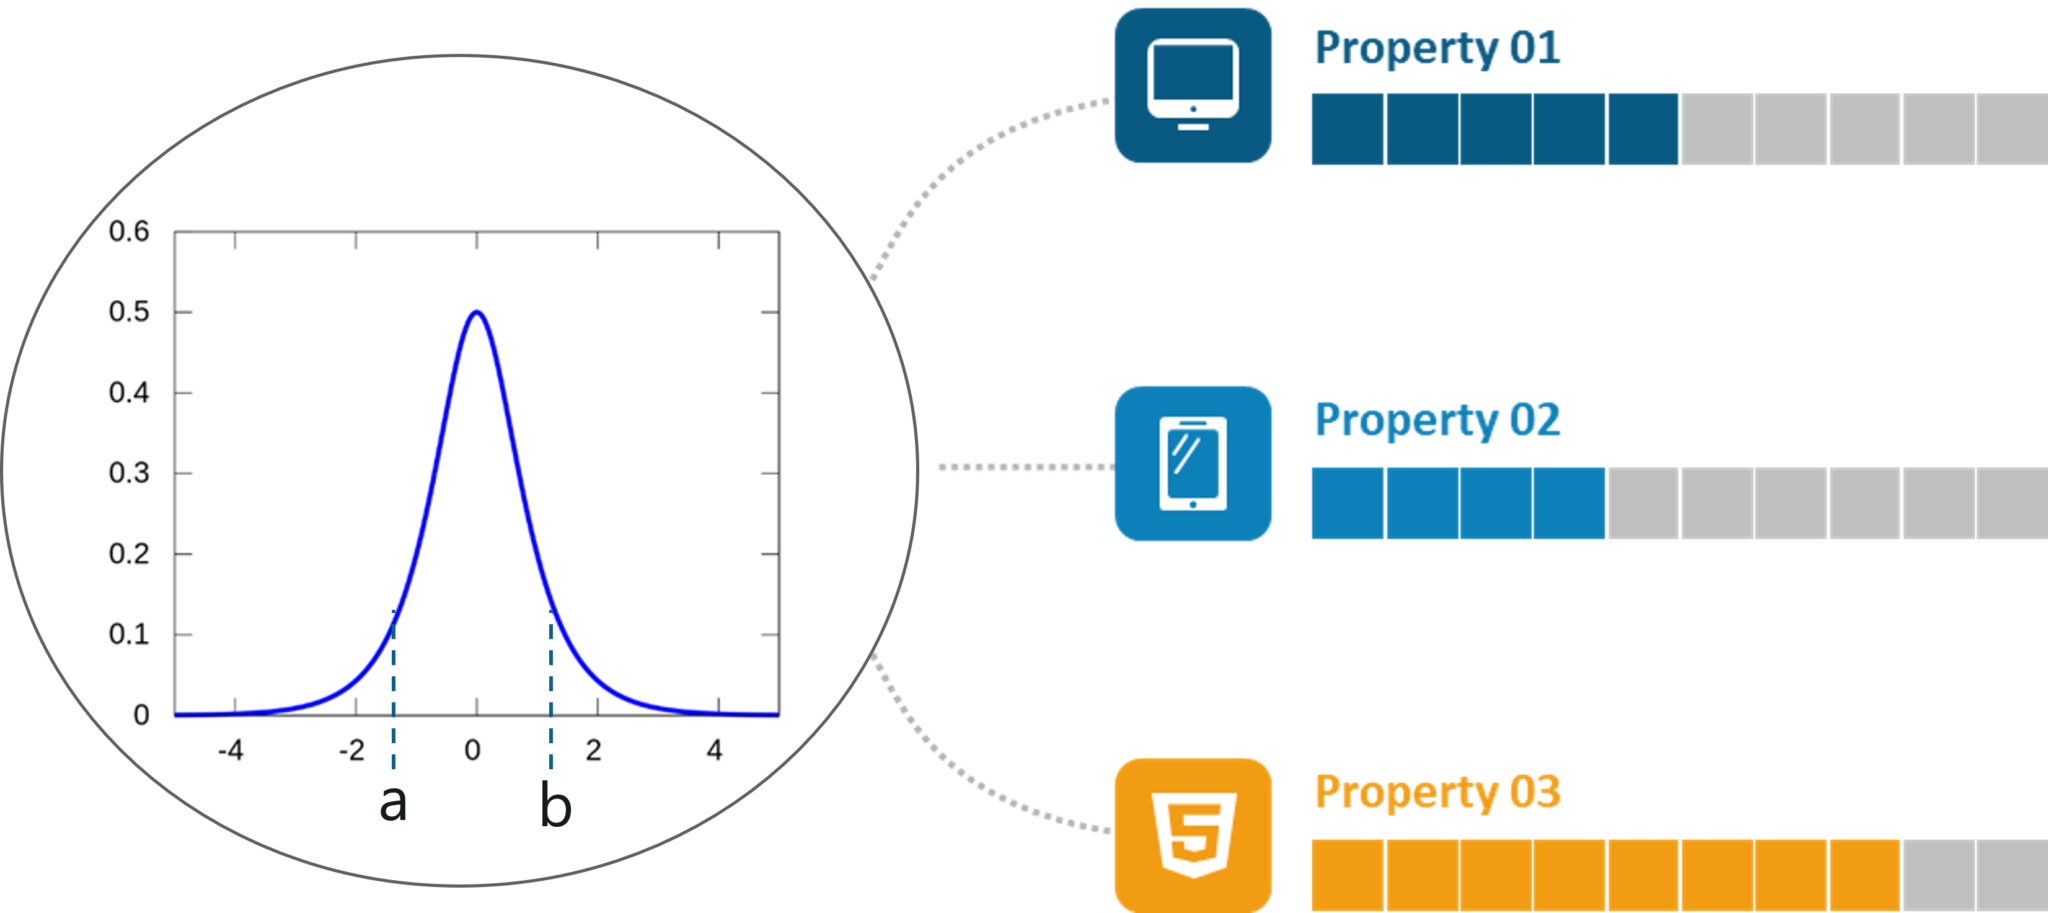
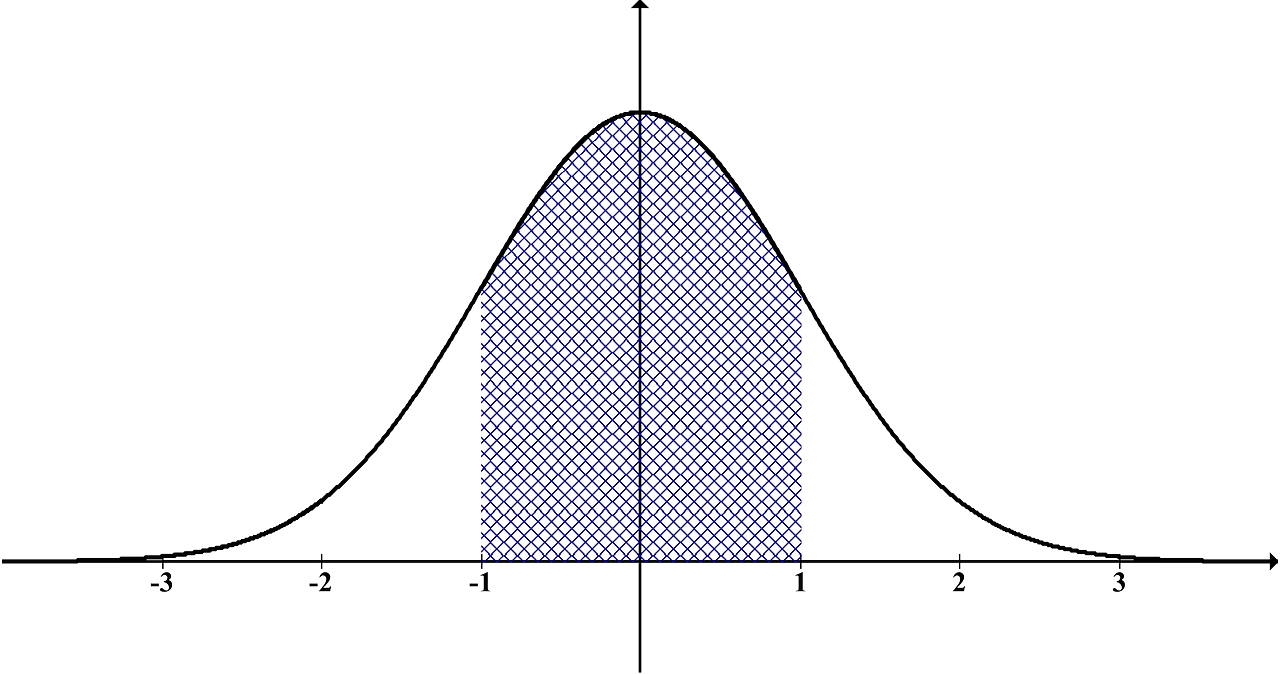
In data analysis, there are two major statistical methods: descriptive statistics, which use indices like the mean or standard deviation to describe data from a sample, and inferential statistics, which derive inferences from data susceptible to random fluctuation (e.g., observational errors, sampling variation). Descriptive statistics are most often concerned with two properties of a distribution (sample or population): central tendency (or location) seeks to characterize the distribution’s central or typical value, whereas dispersion (or variability) seeks to characterize the extent to which members of the distribution depart from its center and each other. Probability theory, which deals with examining random occurrences, is used to make inferences based on mathematical statistics.
A standard statistical process gathers data to evaluate the link between two statistical data sets or between a data set and synthetic data generated from an idealized model. The statistical link between the two data sets is hypothesized, and it is contrasted to an idealized null hypothesis of no association between the two data sets. Statistical tests that quantify the sense in which the null hypothesis may be shown untrue given the evidence provided in the test are used to reject or disprove the null hypothesis.
When working with a null hypothesis, there are two types of mistakes to be aware of: Type I errors (where the null hypothesis is incorrectly rejected, resulting in a “false positive”) and Type II errors (when the null hypothesis is incorrectly rejected, resulting in a “false negative”) (null hypothesis fails to be rejected and an actual relationship between populations is missed giving a “false negative”). This approach has been linked to a number of issues, ranging from acquiring a suitable sample size to defining an appropriate null hypothesis.
Mistakes can also be found in the measurement methods that create statistical data. Many of these errors are classed as random (noise) or systematic (bias), although other sorts of errors (for example, blunders, when an analyst reports wrong units) can also occur. Missing data or censoring can cause estimates to be skewed, and specialized approaches have been developed to overcome these issues.
Download Statistics PNG images transparent gallery.
-

- Statistics Silhouette PNG Images

Resolution: 770 × 980
Size: 24 KB
Image Format: .png
Download
-

- Statistics Silhouette Transparent

Resolution: 894 × 980
Size: 12 KB
Image Format: .png
Download
-

- Statistics PNG Free Image

Resolution: 3920 × 3919
Size: 608 KB
Image Format: .png
Download
-

- Statistics PNG

Resolution: 800 × 800
Size: 14 KB
Image Format: .png
Download
-

- Statistics Vector

Resolution: 980 × 984
Size: 28 KB
Image Format: .png
Download
-

- Statistics Vector PNG
Resolution: 1280 × 1280
Size: 186 KB
Image Format: .png
Download
-

- Statistics Vector PNG Pic

Resolution: 1280 × 1109
Size: 12 KB
Image Format: .png
Download
-

- Statistics Vector PNG File
Resolution: 819 × 661
Size: 16 KB
Image Format: .png
Download
-

- Statistics PNG Pic
Resolution: 980 × 822
Size: 81 KB
Image Format: .png
Download
-

- Statistics Vector PNG Image
Resolution: 982 × 776
Size: 121 KB
Image Format: .png
Download
-

- Statistics PNG Image
Resolution: 2048 × 913
Size: 199 KB
Image Format: .png
Download
-

- Statistics Silhouette PNG Pic

Resolution: 980 × 982
Size: 58 KB
Image Format: .png
Download
-

- Statistics Silhouette
Resolution: 950 × 980
Size: 33 KB
Image Format: .png
Download
-

- Statistics Silhouette PNG Image

Resolution: 980 × 978
Size: 26 KB
Image Format: .png
Download
-

- Statistics PNG Photo

Resolution: 1178 × 831
Size: 123 KB
Image Format: .png
Download
-

- Statistics PNG Cutout
Resolution: 1001 × 707
Size: 84 KB
Image Format: .png
Download
-

- Statistics Vector PNG Photo

Resolution: 800 × 560
Size: 131 KB
Image Format: .png
Download
-

- Statistics Vector PNG Cutout
Resolution: 1445 × 1011
Size: 43 KB
Image Format: .png
Download
-

- Statistics PNG Images
Resolution: 1000 × 601
Size: 41 KB
Image Format: .png
Download
-

- Statistics Silhouette PNG Photo

Resolution: 980 × 724
Size: 18 KB
Image Format: .png
Download
-

- Statistics Vector PNG Images
Resolution: 1367 × 645
Size: 49 KB
Image Format: .png
Download
-

- Statistics Vector PNG Photos
Resolution: 893 × 720
Size: 239 KB
Image Format: .png
Download
-

- Statistics Vector PNG Clipart
Resolution: 1416 × 839
Size: 65 KB
Image Format: .png
Download
-

- Statistics PNG Photos
Resolution: 1280 × 674
Size: 126 KB
Image Format: .png
Download
-

- Statistics Transparent

Resolution: 760 × 980
Size: 19 KB
Image Format: .png
Download
-

- Statistics Silhouette PNG Cutout

Resolution: 999 × 924
Size: 17 KB
Image Format: .png
Download
-
- Statistics Silhouette PNG
Resolution: 980 × 978
Size: 53 KB
Image Format: .png
Download
-

- Statistics PNG Clipart

Resolution: 960 × 678
Size: 127 KB
Image Format: .png
Download
-

- Statistics PNG Picture

Resolution: 750 × 750
Size: 40 KB
Image Format: .png
Download
-

- Statistics Vector PNG HD Image

Resolution: 1851 × 1423
Size: 69 KB
Image Format: .png
Download
-

- Statistics Vector PNG Image HD
Resolution: 1200 × 700
Size: 55 KB
Image Format: .png
Download
-

- Statistics PNG HD Image
Resolution: 690 × 720
Size: 112 KB
Image Format: .png
Download
-
- Statistics PNG Image HD

Resolution: 750 × 750
Size: 29 KB
Image Format: .png
Download
-

- Statistics Vector No Background
Resolution: 695 × 720
Size: 20 KB
Image Format: .png
Download
-

- Statistics No Background
Resolution: 2000 × 1380
Size: 182 KB
Image Format: .png
Download
-

- Statistics Silhouette PNG Photos

Resolution: 980 × 760
Size: 33 KB
Image Format: .png
Download
-

- Statistics PNG Images HD
Resolution: 4117 × 1425
Size: 263 KB
Image Format: .png
Download
-

- Statistics

Resolution: 1344 × 1527
Size: 63 KB
Image Format: .png
Download
-

- Statistics PNG File
Resolution: 793 × 442
Size: 42 KB
Image Format: .png
Download
-
- Statistics Silhouette PNG File

Resolution: 980 × 982
Size: 51 KB
Image Format: .png
Download
-

- Statistics Vector Transparent
Resolution: 1095 × 881
Size: 47 KB
Image Format: .png
Download
-

- Statistics Vector PNG Picture
Resolution: 1280 × 1052
Size: 148 KB
Image Format: .png
Download