Download top and best high-quality free Bar Chart PNG Transparent Images backgrounds available in various sizes. To view the full PNG size resolution click on any of the below image thumbnail.
License Info: Creative Commons 4.0 BY-NC
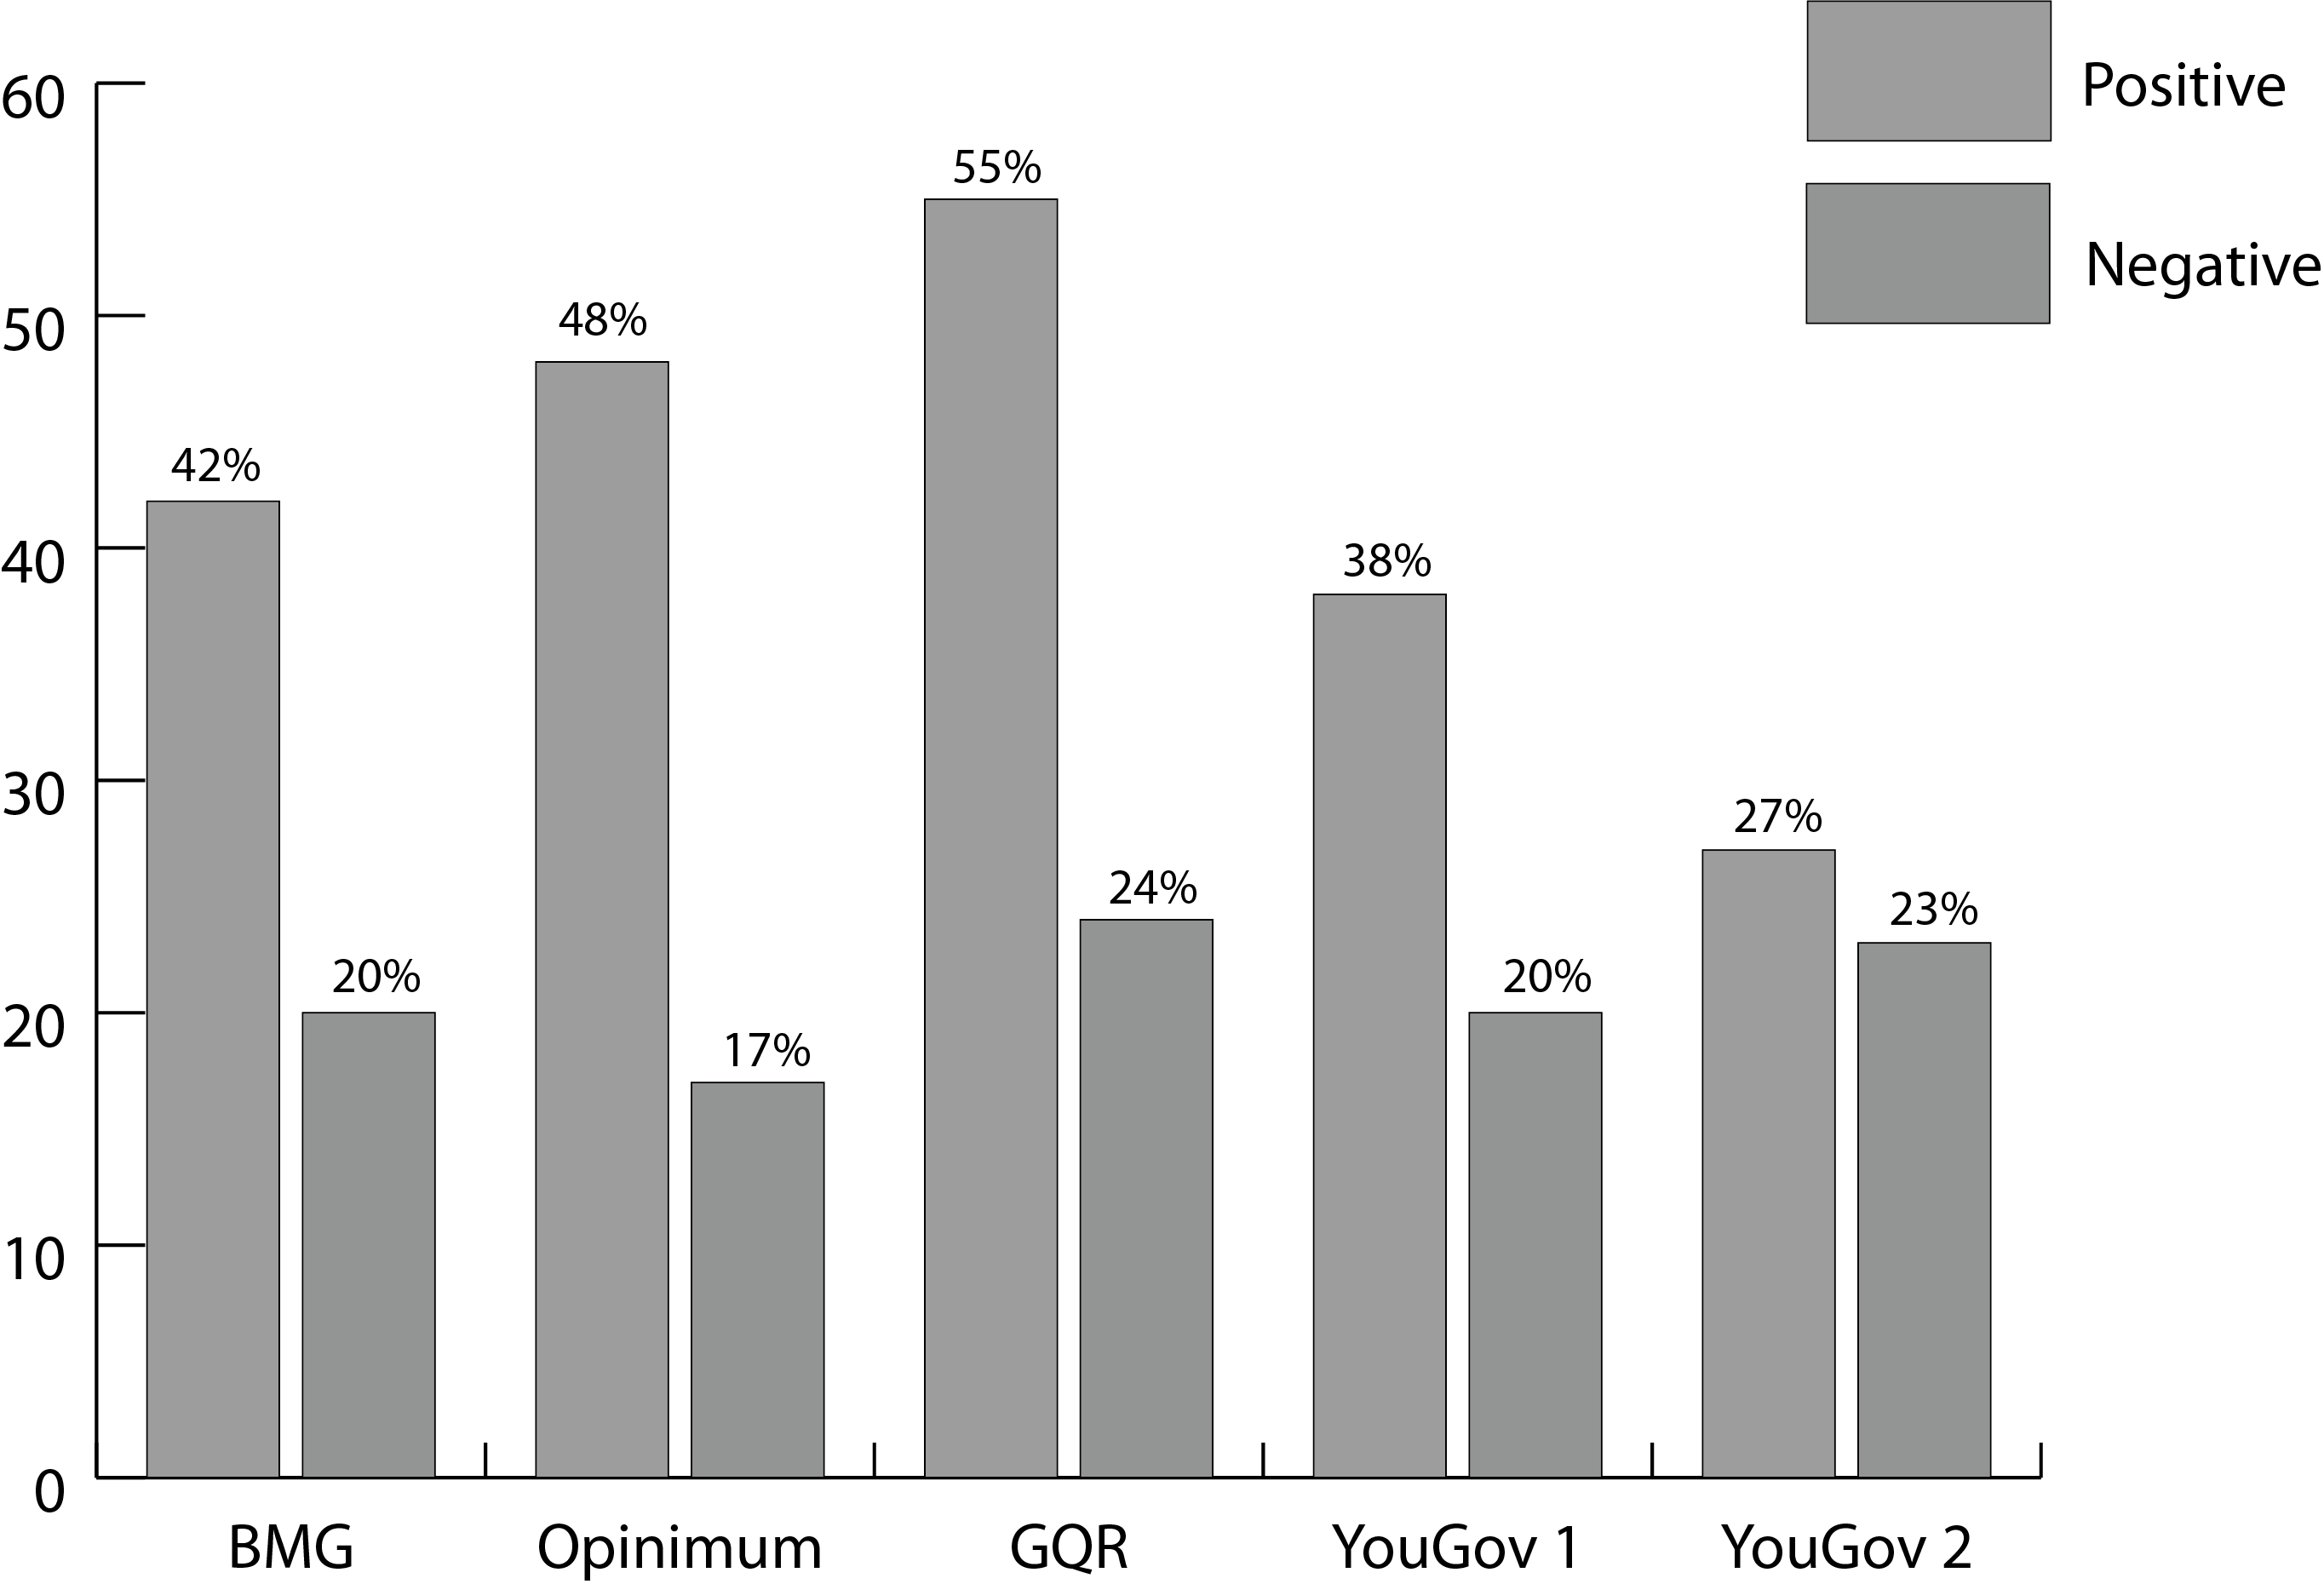
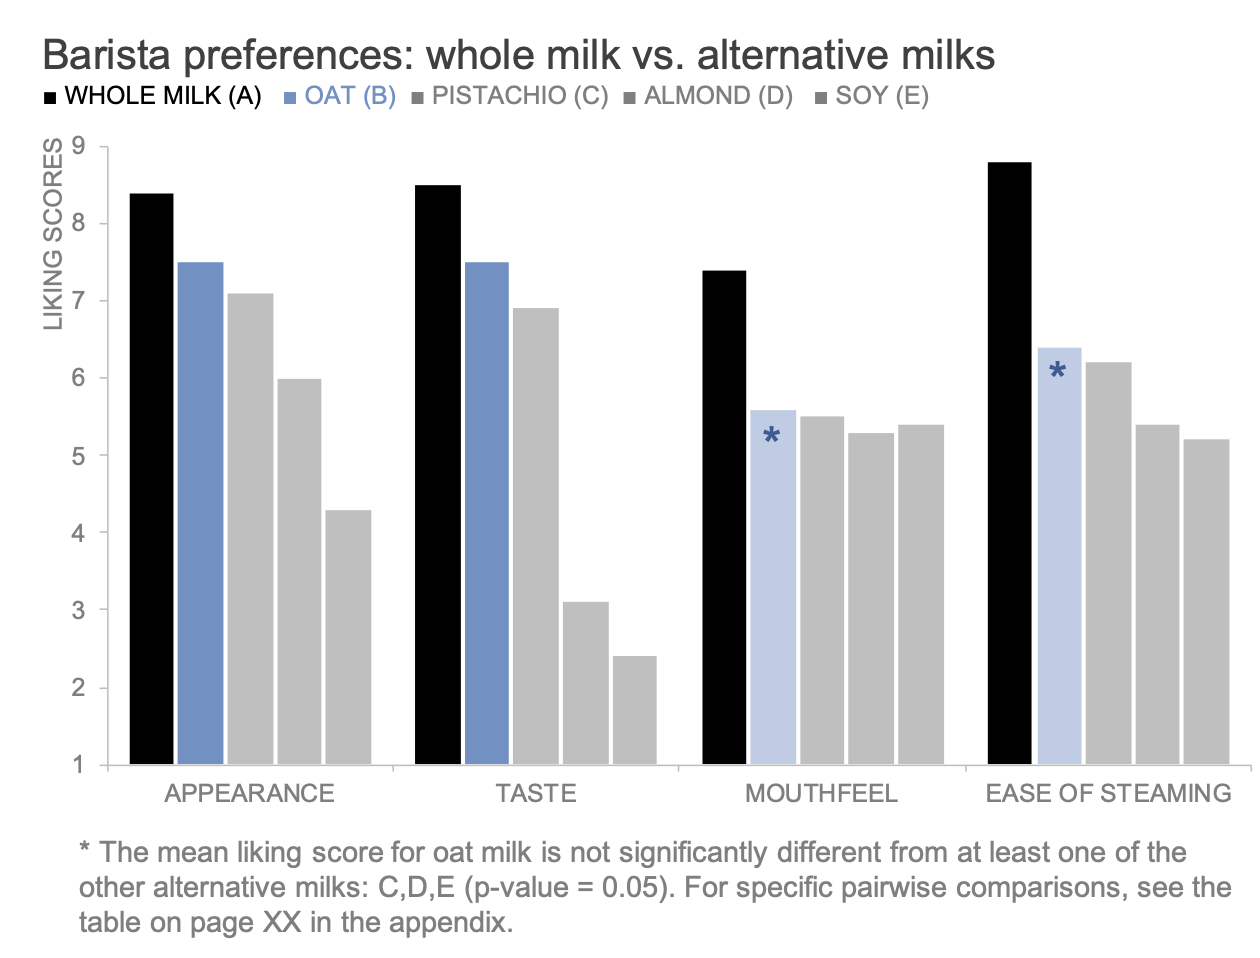
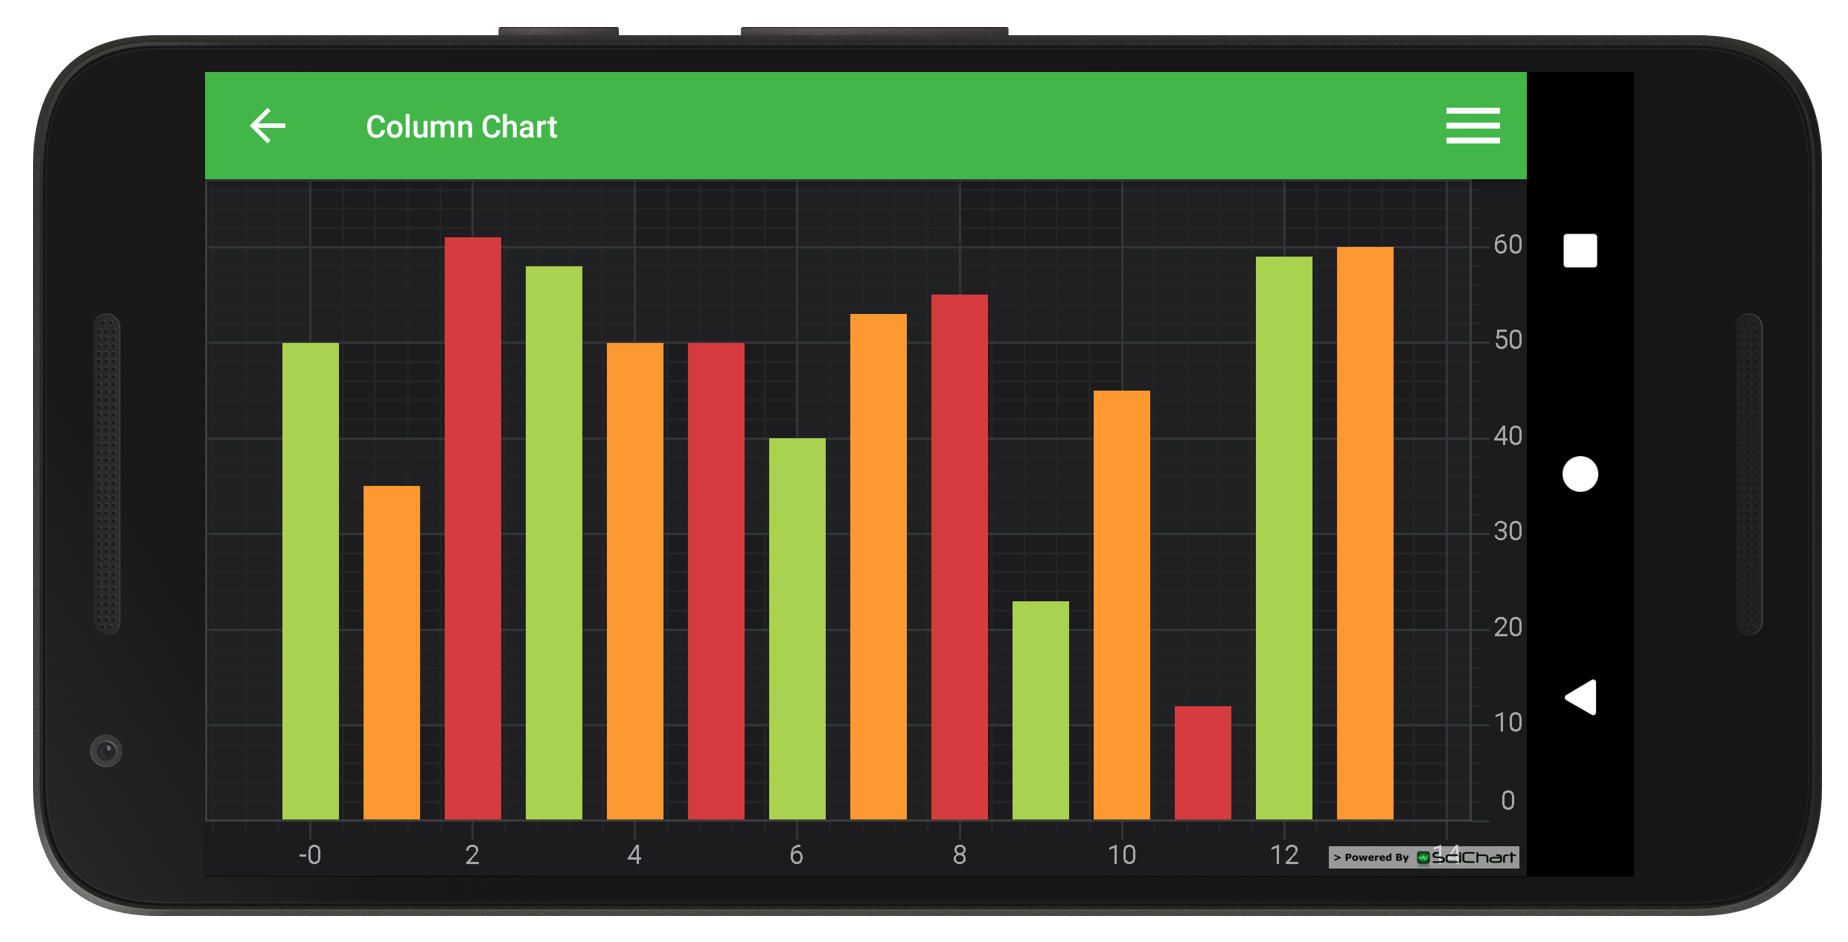
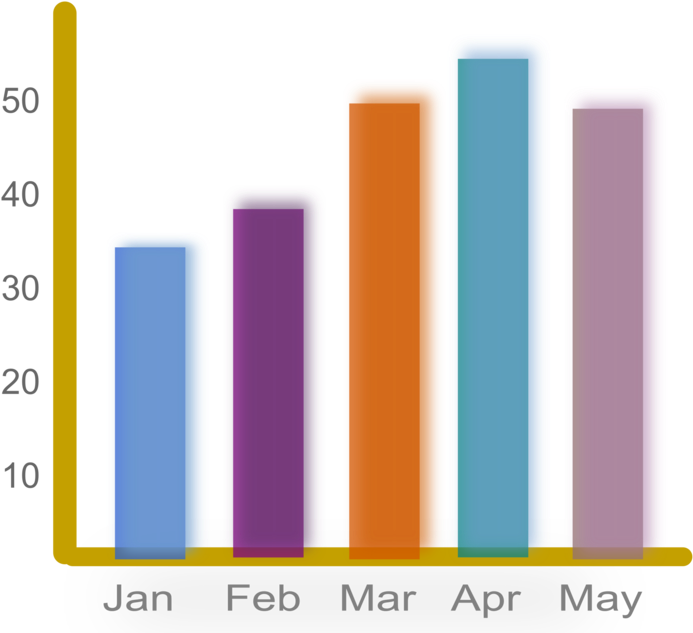
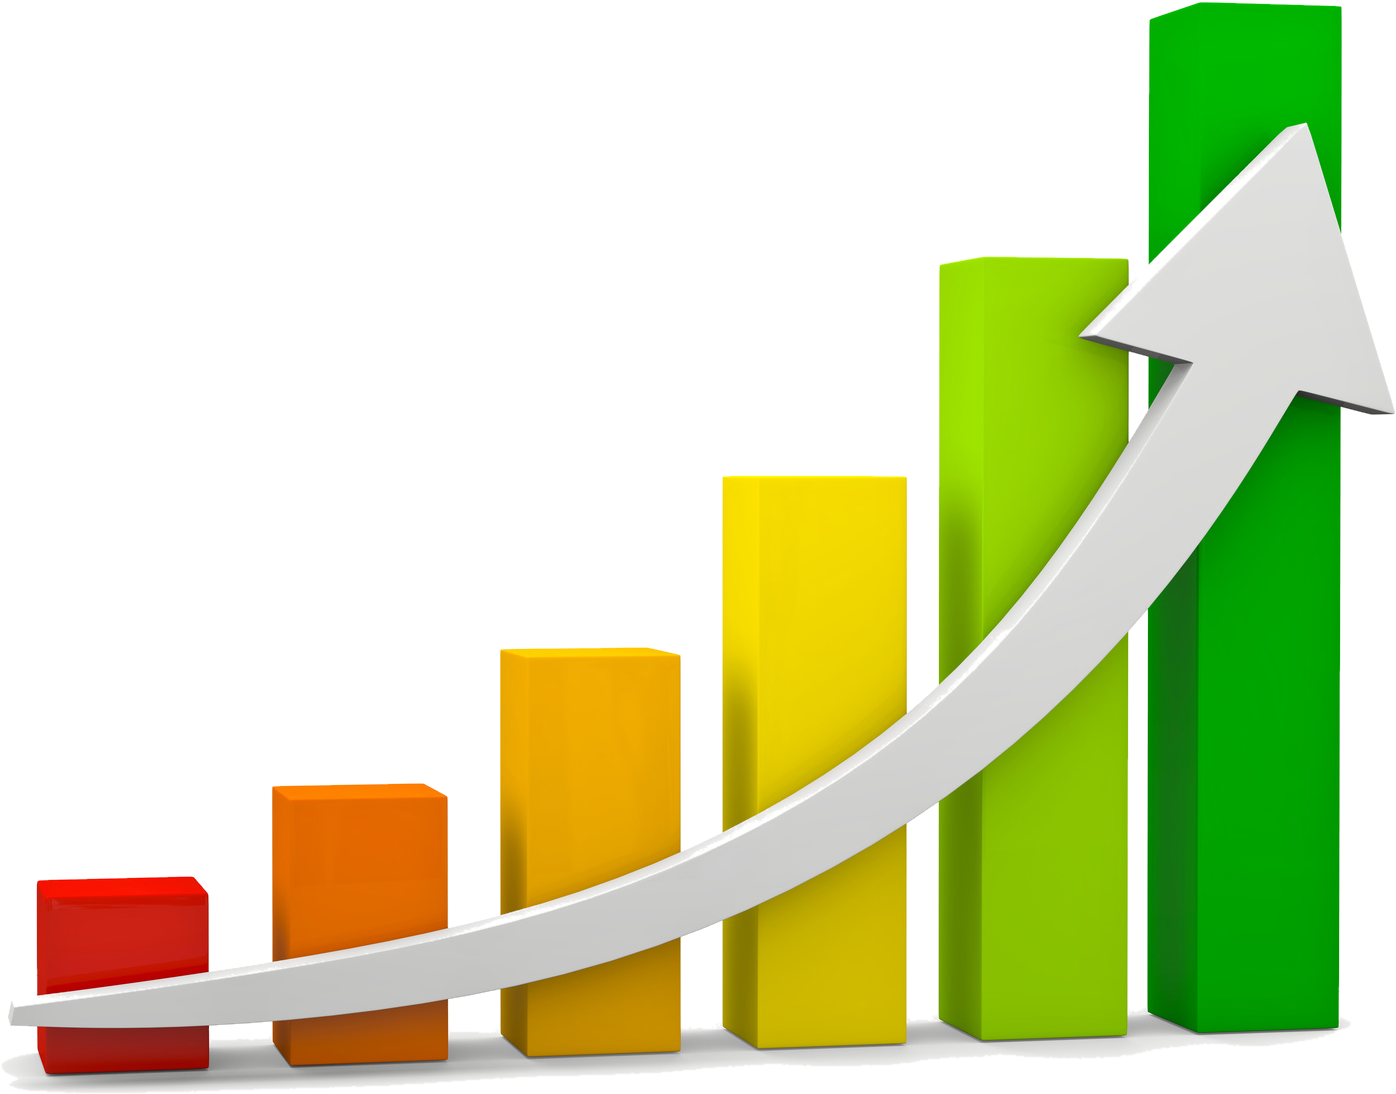
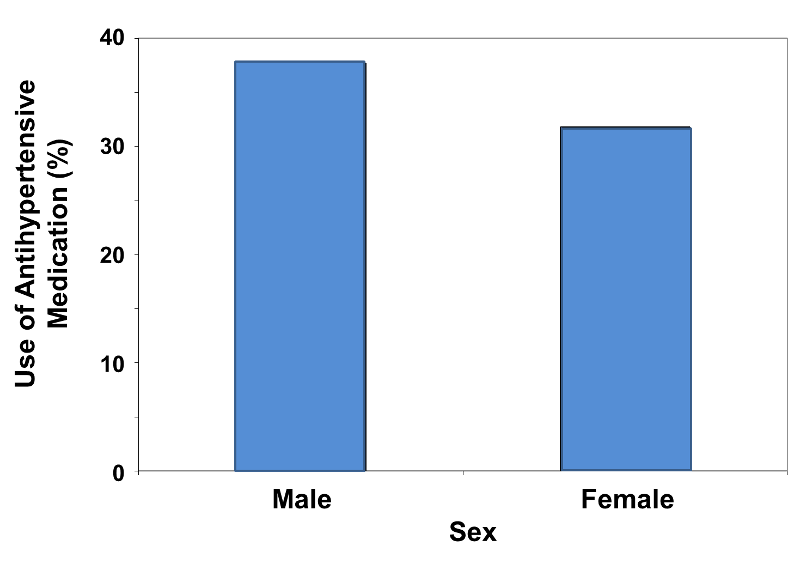
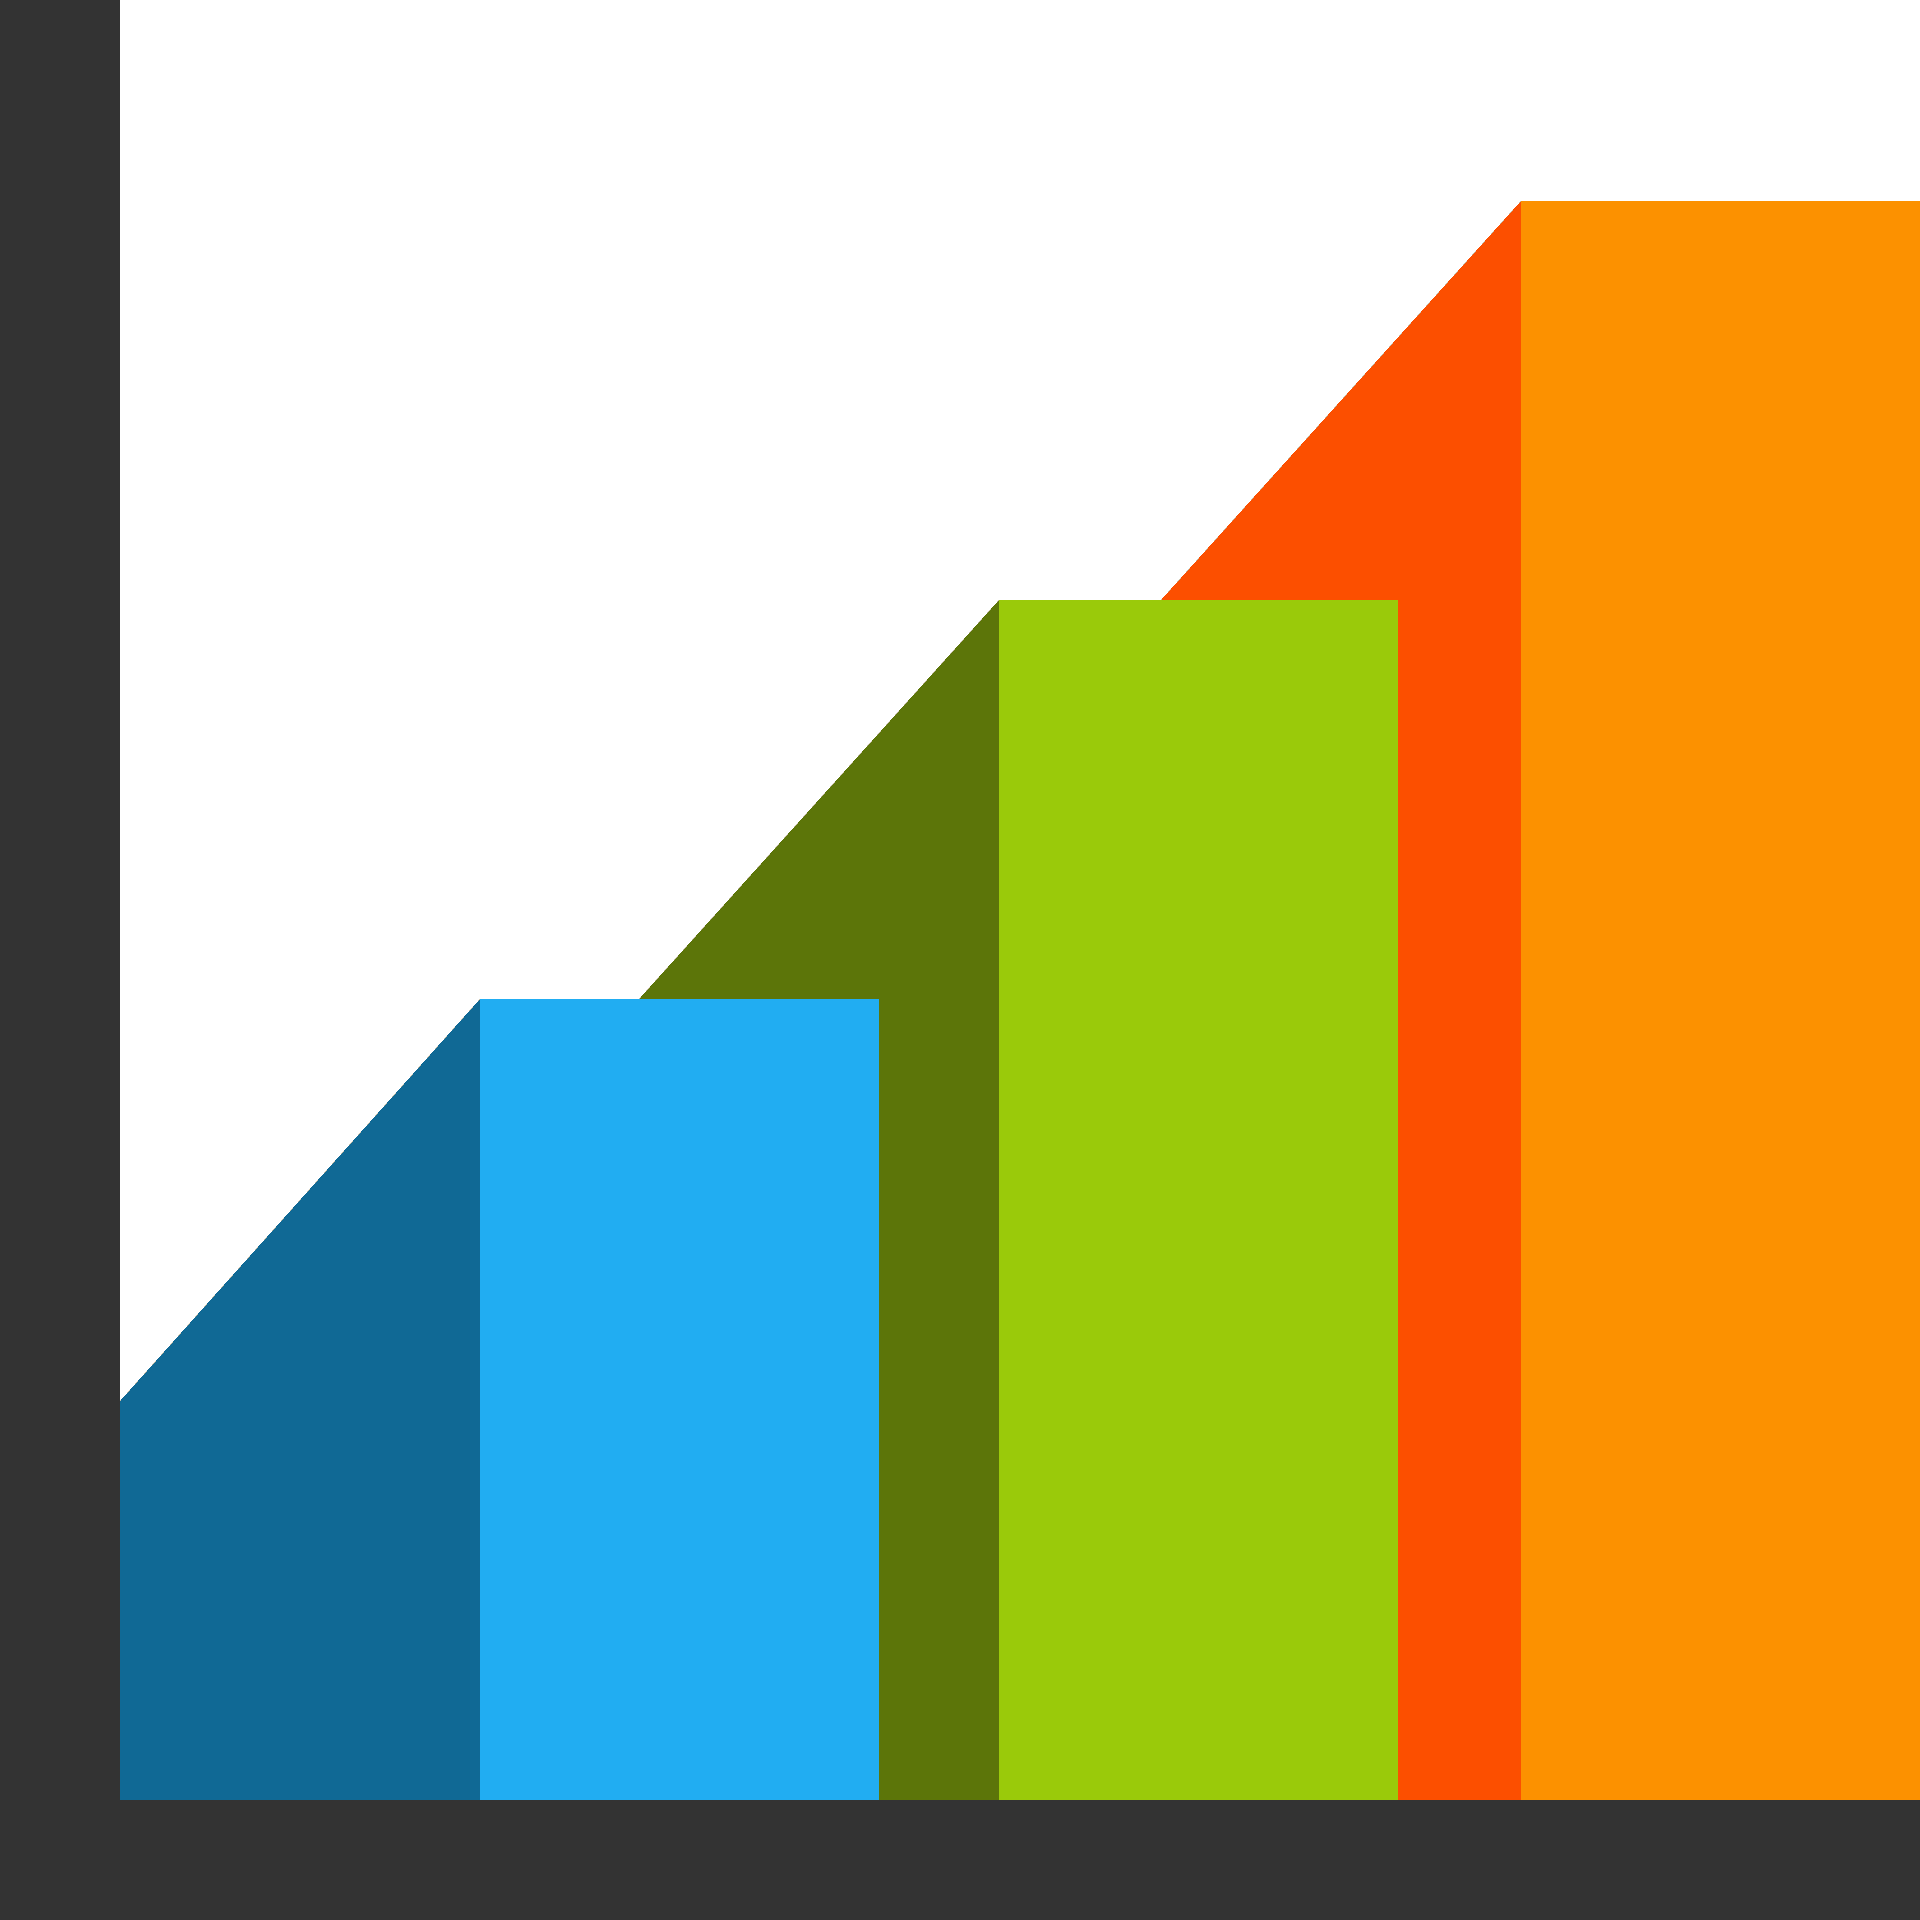
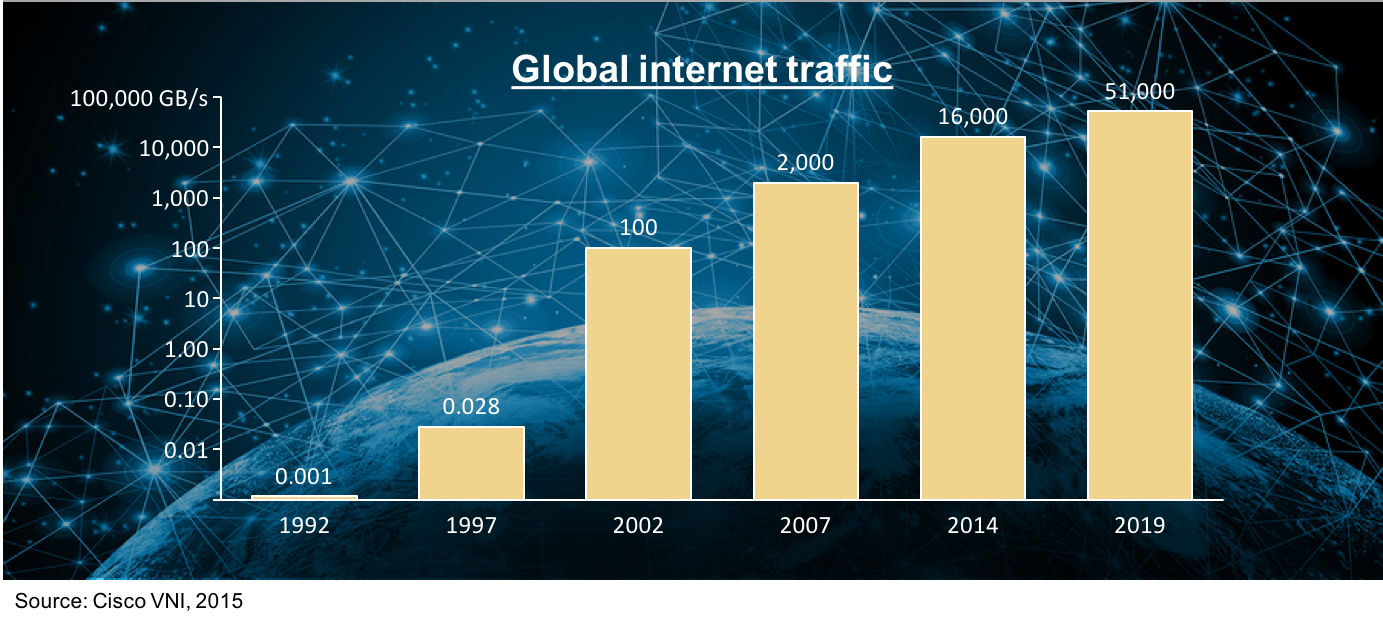
A bar chart or bar graph is a chart or graph that uses rectangular bars with heights or lengths proportionate to the values they represent to show categorical data. The bars can be plotted either horizontally or vertically. A column chart is another name for a vertical bar chart.
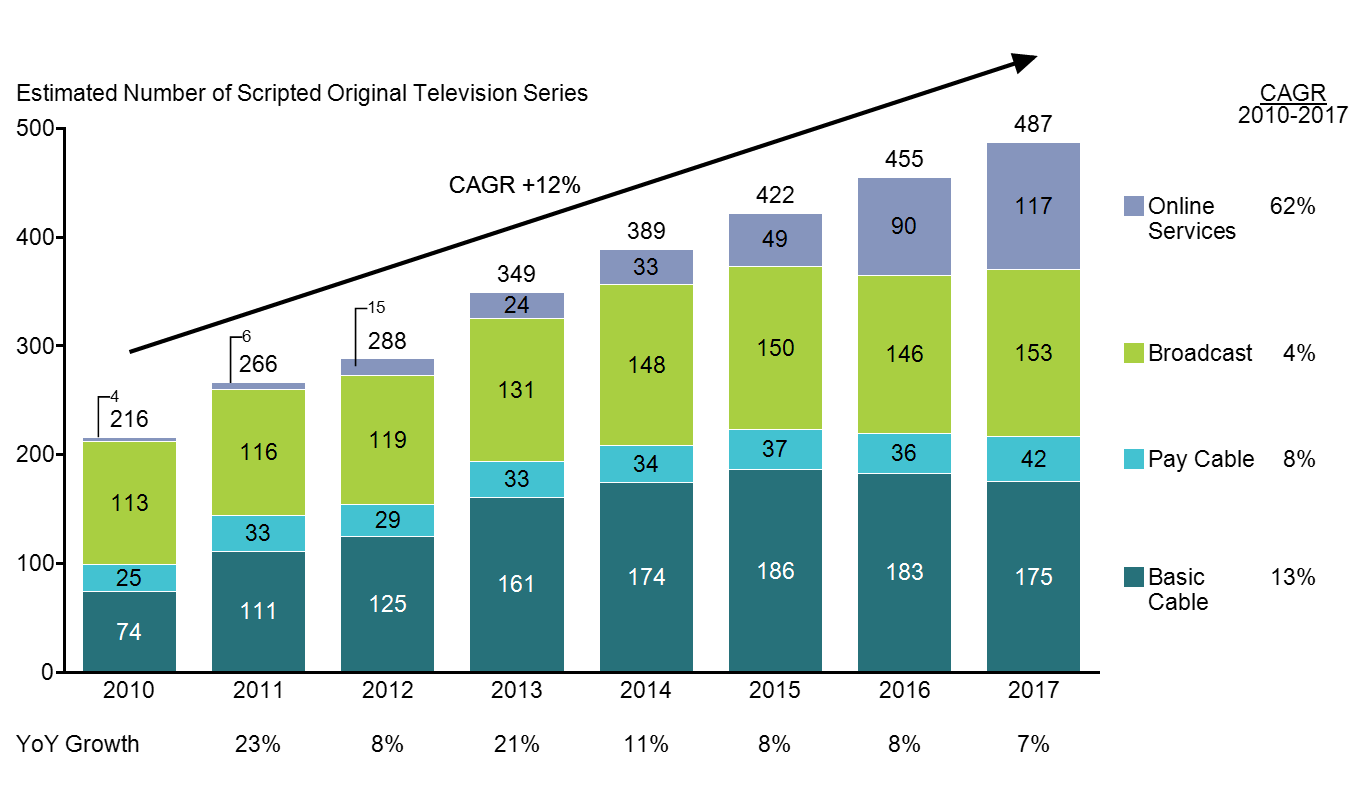
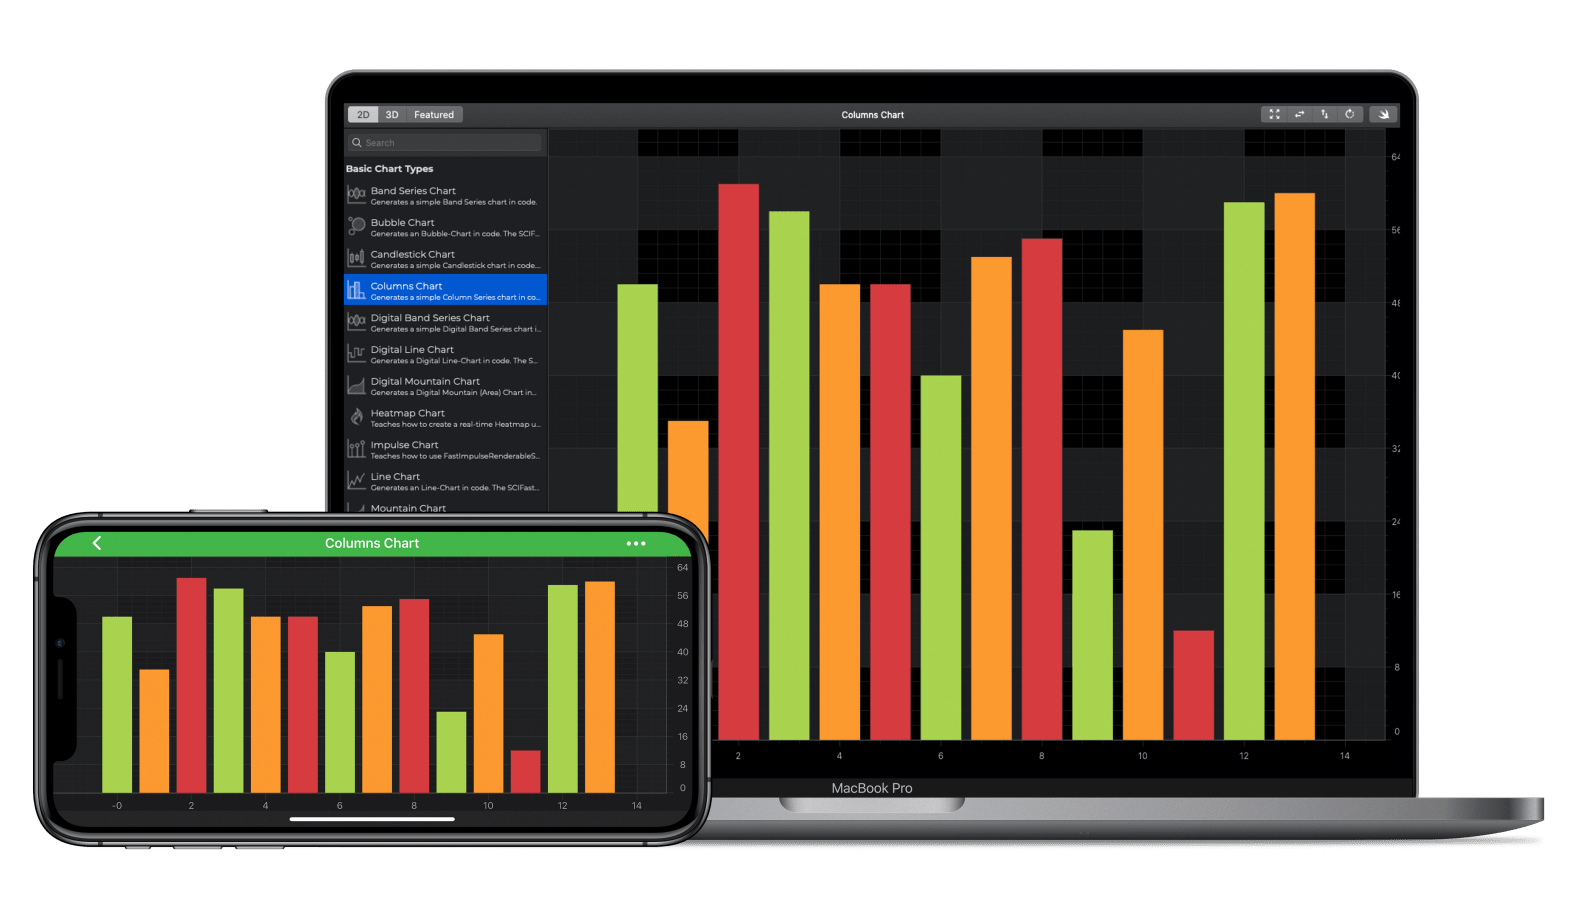
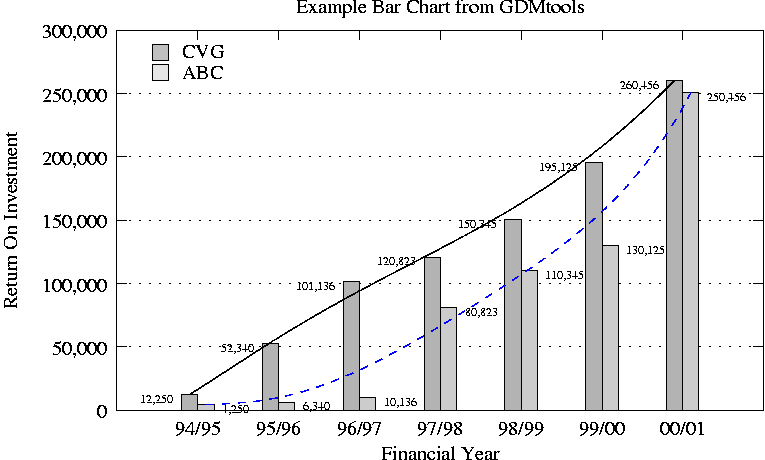
Comparisons between discrete categories are shown in a bar graph. The chart’s one axis depicts the precise categories being compared, while the other displays a numerical value. Some bar graphs include many bars grouped together to illustrate the values of multiple measured variables.
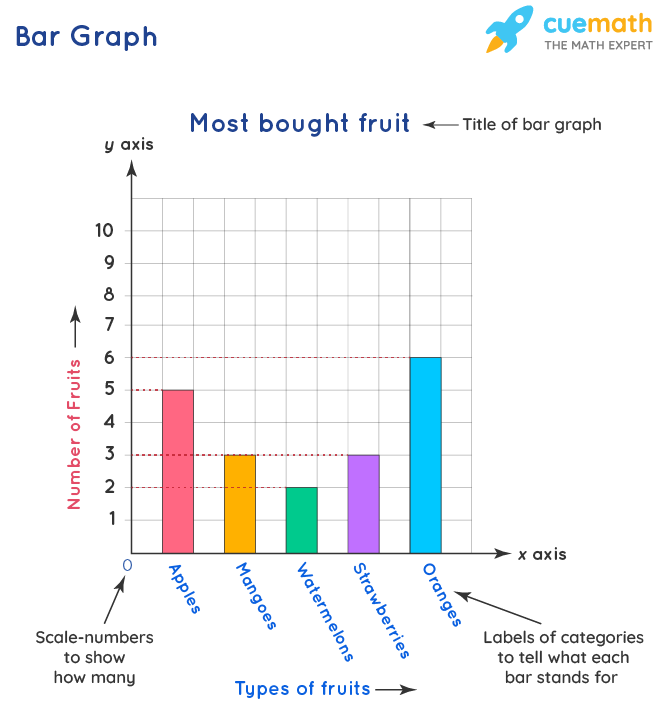
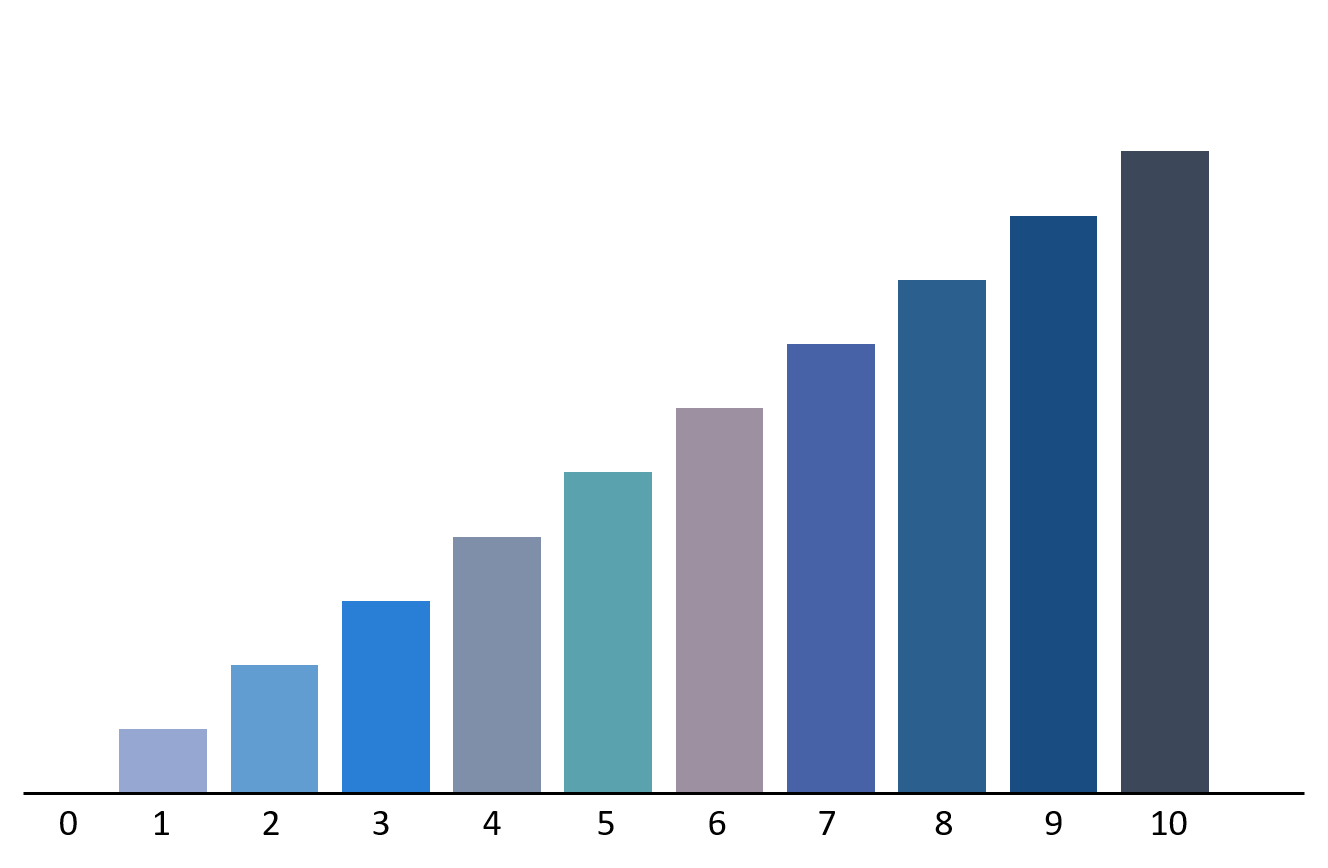
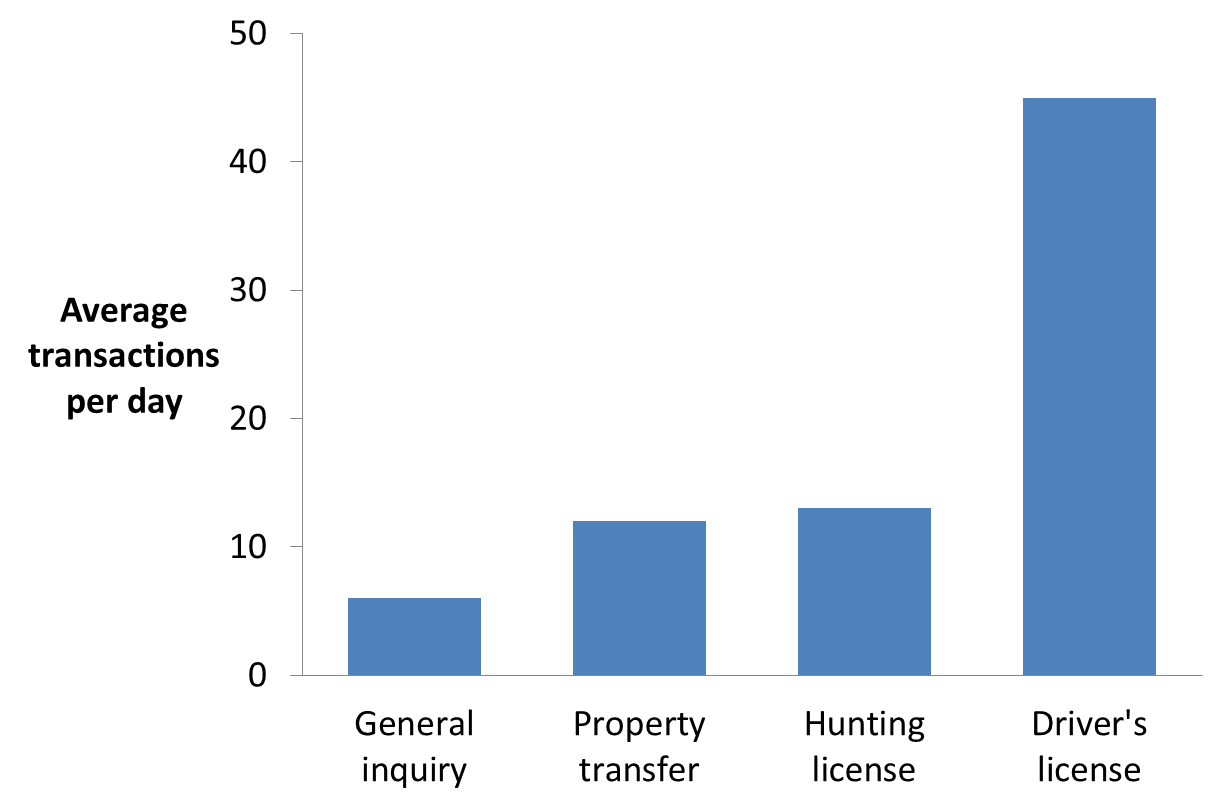
Bar graphs and charts are used to visualise category data. Categorical data is the division of information into distinct categories, such as months of the year, age groups, shoe sizes, and animals. These are generally qualitative categories. Categories appear along the horizontal axis in a column (vertical) bar chart, and the height of the bar corresponds to the value of each category.
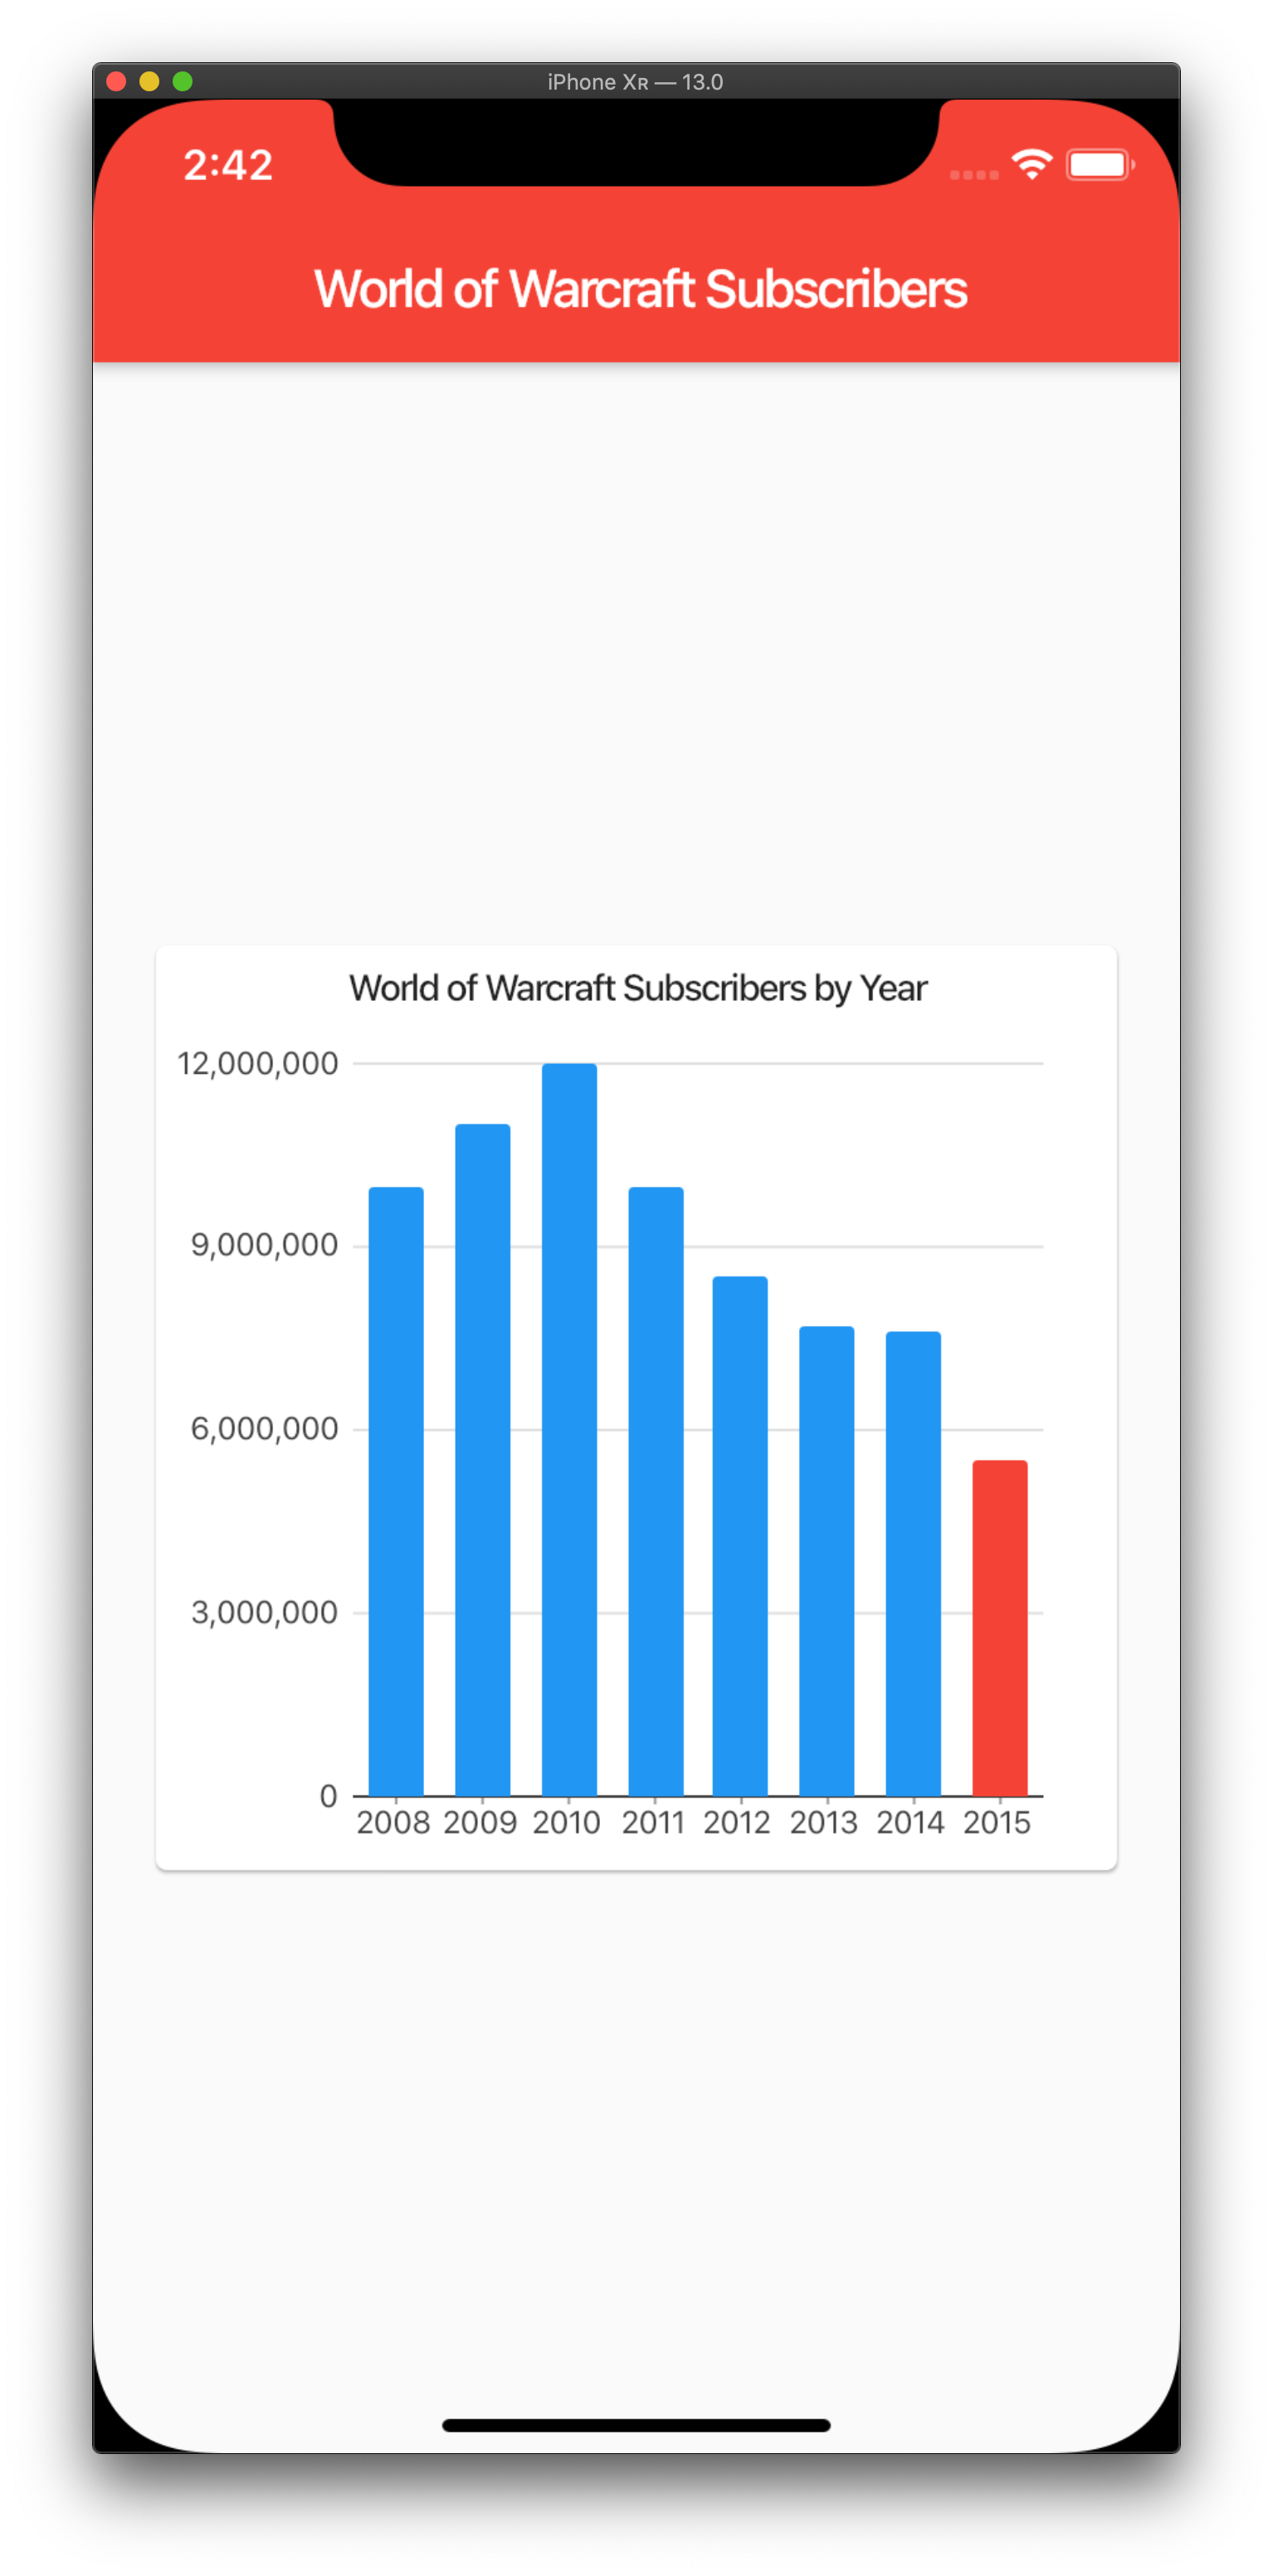
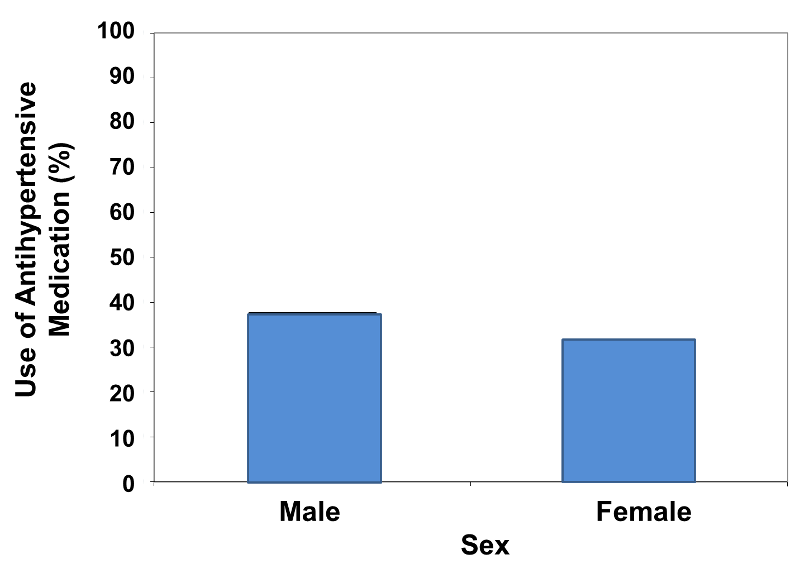
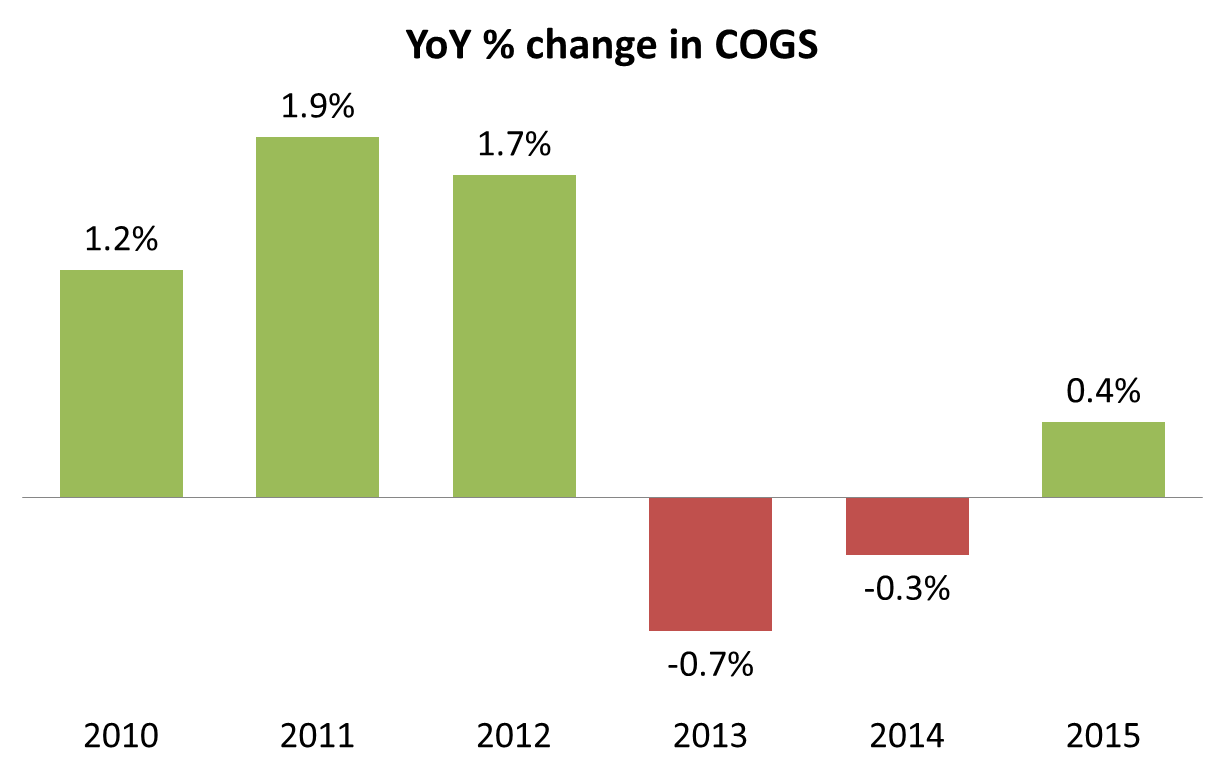
Bar charts have a discrete scope of categories and are often scaled to accommodate all of the data on the graph. When the categories being compared do not have a natural ordering, the bars on the chart can be placed in any sequence. Pareto charts are bar charts that are sorted from highest to lowest incidence.
Download Bar Chart PNG images transparent gallery.
-

- Bar Chart No Background
Resolution: 2729 × 1860
Size: 66 KB
Image Format: .png
Download
-

- Bar Chart PNG Images HD
Resolution: 663 × 713
Size: 32 KB
Image Format: .png
Download
-

- Bar Chart PNG Free Image
Resolution: 1534 × 3104
Size: 954 KB
Image Format: .png
Download
-

- Bar Chart PNG Image File
Resolution: 958 × 928
Size: 102 KB
Image Format: .png
Download
-

- Bar Chart Background PNG
Resolution: 1260 × 958
Size: 64 KB
Image Format: .png
Download
-

- Bar Chart PNG Background
Resolution: 1848 × 942
Size: 331 KB
Image Format: .png
Download
-

- Bar Chart Vector
Resolution: 980 × 754
Size: 5 KB
Image Format: .png
Download
-

- Bar Chart Vector PNG Photo
Resolution: 714 × 622
Size: 109 KB
Image Format: .png
Download
-

- Bar Chart Vector PNG Images
Resolution: 693 × 633
Size: 59 KB
Image Format: .png
Download
-

- Bar Chart Vector Transparent
Resolution: 1350 × 801
Size: 22 KB
Image Format: .png
Download
-

- Bar Chart Vector PNG HD Image
Resolution: 841 × 1037
Size: 25 KB
Image Format: .png
Download
-

- Bar Chart Vector PNG Free Image
Resolution: 1980 × 2400
Size: 161 KB
Image Format: .png
Download
-

- Bar Chart Vector PNG Image File
Resolution: 1396 × 1094
Size: 565 KB
Image Format: .png
Download
-

- Bar Chart Vector Background PNG
Resolution: 1572 × 920
Size: 139 KB
Image Format: .png
Download
-

- Bar Chart Vector PNG Background
Resolution: 668 × 671
Size: 10 KB
Image Format: .png
Download
-

- Bar Chart Vector PNG
Resolution: 716 × 691
Size: 78 KB
Image Format: .png
Download
-

- Bar Chart Vector PNG Pic
Resolution: 1350 × 762
Size: 24 KB
Image Format: .png
Download
-

- Bar Chart Vector PNG File
Resolution: 2440 × 2977
Size: 56 KB
Image Format: .png
Download
-

- Bar Chart Vector PNG Image
Resolution: 1351 × 801
Size: 20 KB
Image Format: .png
Download
-

- Bar Chart
Resolution: 850 × 506
Size: 39 KB
Image Format: .png
Download
-

- Bar Chart PNG
Resolution: 800 × 564
Size: 22 KB
Image Format: .png
Download
-

- Bar Chart PNG Pic
Resolution: 798 × 398
Size: 15 KB
Image Format: .png
Download
-

- Bar Chart Silhouette

Resolution: 2000 × 2000
Size: 21 KB
Image Format: .png
Download
-

- Bar Chart PNG File
Resolution: 800 × 578
Size: 26 KB
Image Format: .png
Download
-

- Bar Chart PNG Image
Resolution: 816 × 470
Size: 48 KB
Image Format: .png
Download
-

- Bar Chart Vector PNG Cutout

Resolution: 1401 × 1241
Size: 29 KB
Image Format: .png
Download
-

- Bar Chart PNG Photo
Resolution: 1920 × 1920
Size: 10 KB
Image Format: .png
Download
-
- Bar Chart PNG Cutout

Resolution: 1920 × 1920
Size: 8 KB
Image Format: .png
Download
-

- Bar Chart Silhouette PNG

Resolution: 980 × 958
Size: 34 KB
Image Format: .png
Download
-

- Bar Chart Silhouette PNG Pic
Resolution: 980 × 910
Size: 5 KB
Image Format: .png
Download
-

- Bar Chart Silhouette PNG File

Resolution: 981 × 982
Size: 21 KB
Image Format: .png
Download
-

- Bar Chart PNG Images
Resolution: 765 × 460
Size: 11 KB
Image Format: .png
Download
-

- Bar Chart PNG Photos

Resolution: 1526 × 1526
Size: 36 KB
Image Format: .png
Download
-

- Bar Chart Vector PNG Photos
Resolution: 1328 × 868
Size: 30 KB
Image Format: .png
Download
-

- Bar Chart Transparent
Resolution: 1383 × 624
Size: 1102 KB
Image Format: .png
Download
-

- Bar Chart Vector PNG Clipart

Resolution: 1462 × 1462
Size: 23 KB
Image Format: .png
Download
-

- Bar Chart Vector PNG Picture

Resolution: 1200 × 1200
Size: 8 KB
Image Format: .png
Download
-

- Bar Chart Silhouette PNG Image

Resolution: 980 × 980
Size: 4 KB
Image Format: .png
Download
-

- Bar Chart PNG Clipart
Resolution: 1280 × 1052
Size: 140 KB
Image Format: .png
Download
-

- Bar Chart PNG Picture
Resolution: 1224 × 804
Size: 25 KB
Image Format: .png
Download
-

- Bar Chart PNG HD Image
Resolution: 1224 × 770
Size: 23 KB
Image Format: .png
Download
-

- Bar Chart Silhouette PNG Photo
Resolution: 980 × 842
Size: 12 KB
Image Format: .png
Download
-

- Bar Chart Vector PNG Image HD
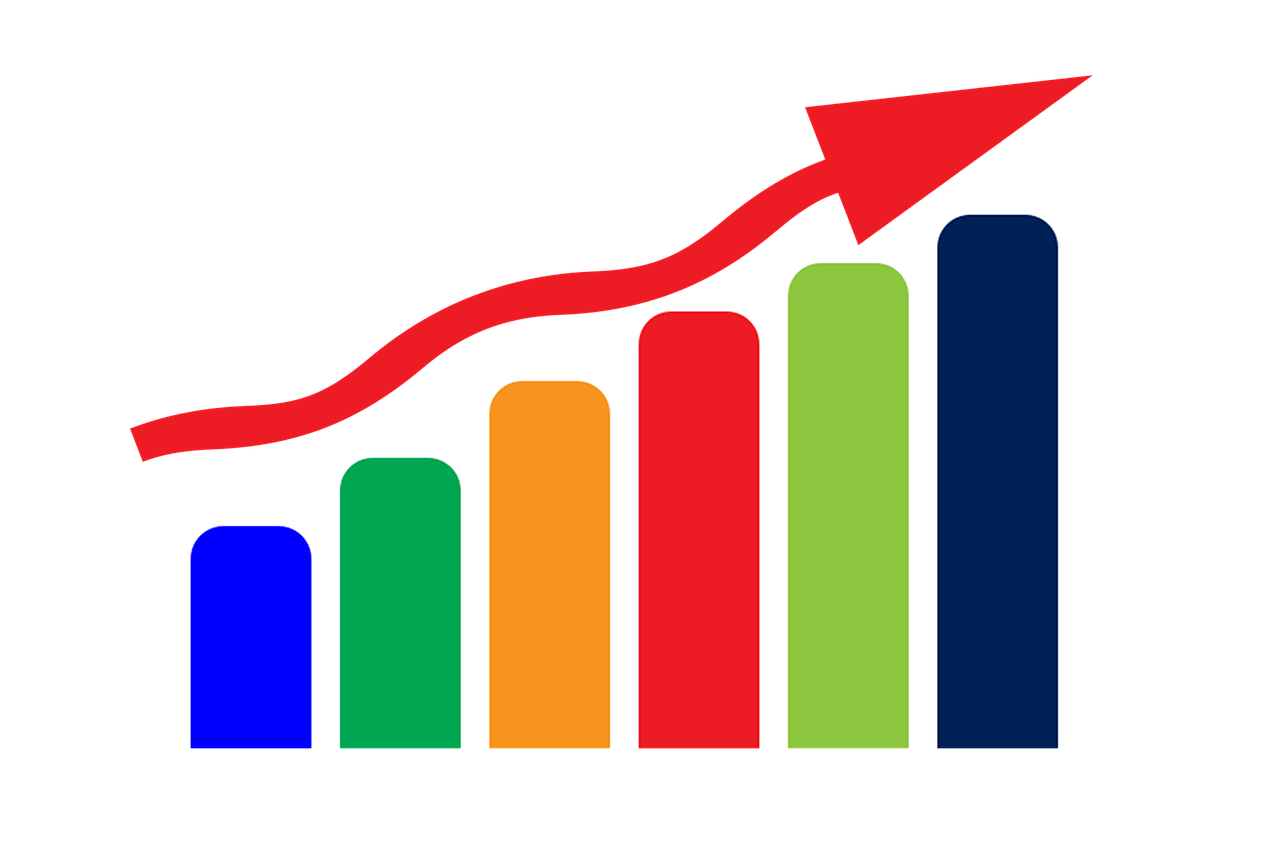
Resolution: 1280 × 853
Size: 50 KB
Image Format: .png
Download
-

- Bar Chart Vector No Background
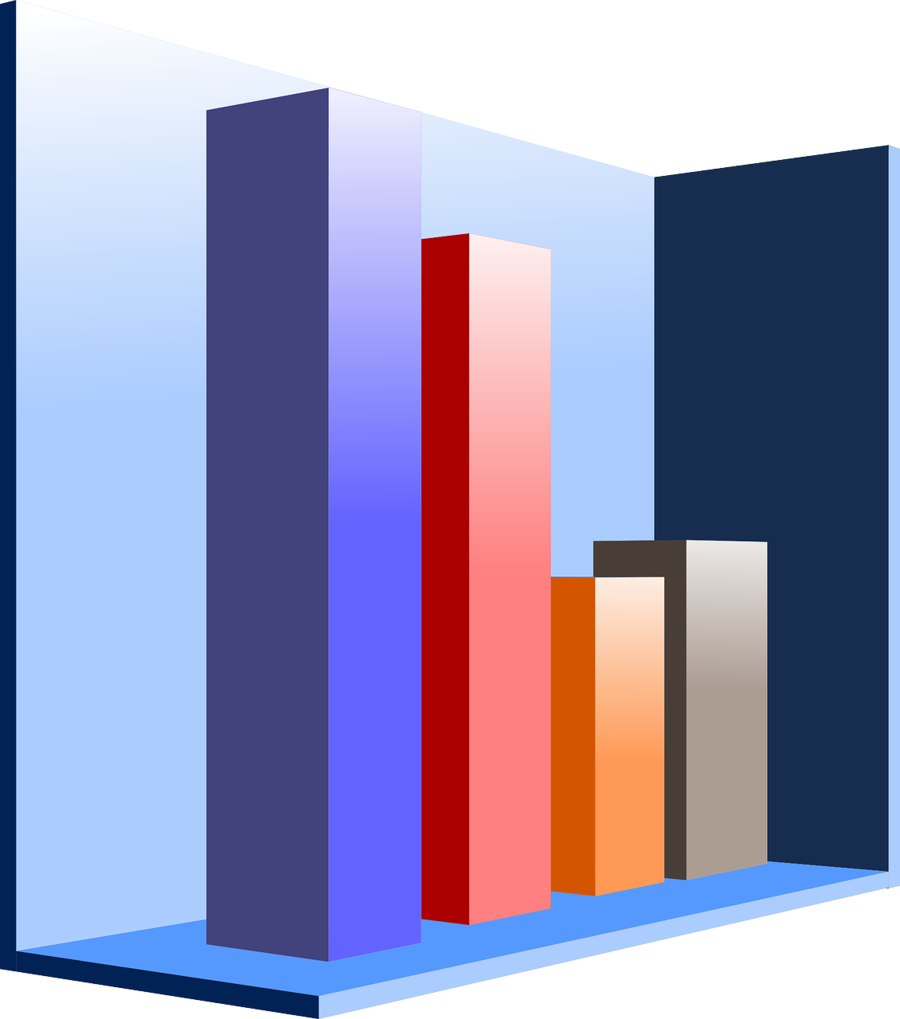
Resolution: 900 × 1019
Size: 81 KB
Image Format: .png
Download
-

- Bar Chart Vector PNG Images HD
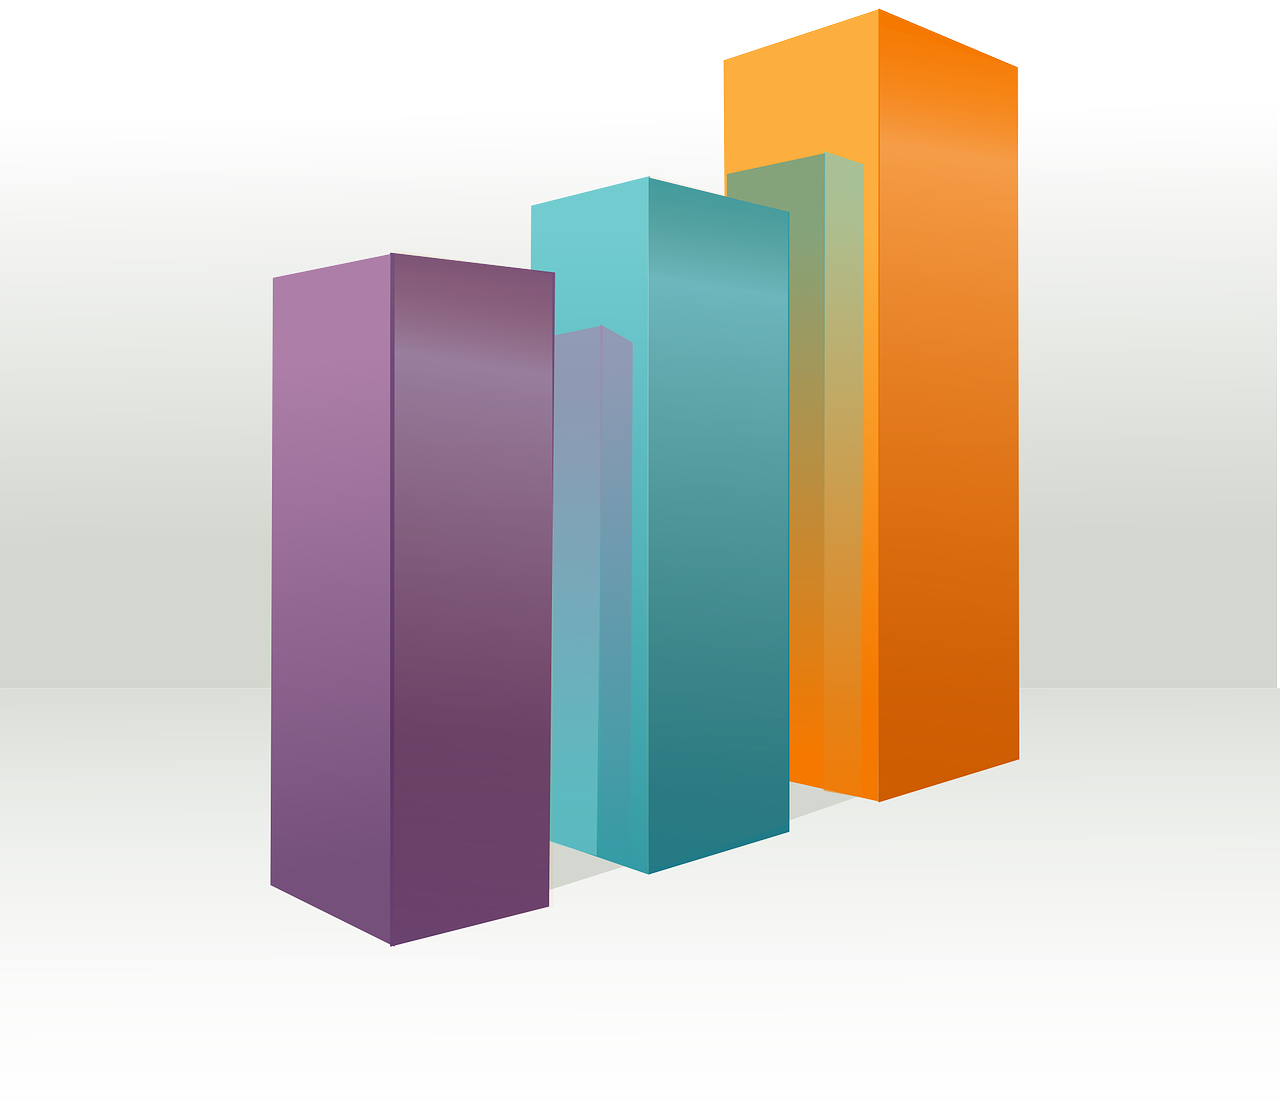
Resolution: 1280 × 1100
Size: 120 KB
Image Format: .png
Download
-

- Bar Chart Silhouette PNG Cutout
Resolution: 980 × 920
Size: 18 KB
Image Format: .png
Download
-

- Bar Chart PNG Image HD
Resolution: 1400 × 600
Size: 1 KB
Image Format: .png
Download