Download top and best high-quality free Graphic PNG Transparent Images backgrounds available in various sizes. To view the full PNG size resolution click on any of the below image thumbnail.
License Info: Creative Commons 4.0 BY-NC
Graphics are visual representations of data, information, or ideas. They are designed to communicate complex concepts in a way that is easy to understand and visually appealing.
In the digital age, graphics are everywhere – on websites, in books, on television, and in magazines. They can be created using a variety of tools, including graphic design software, photography, and even hand-drawn illustrations.
Types of Graphics
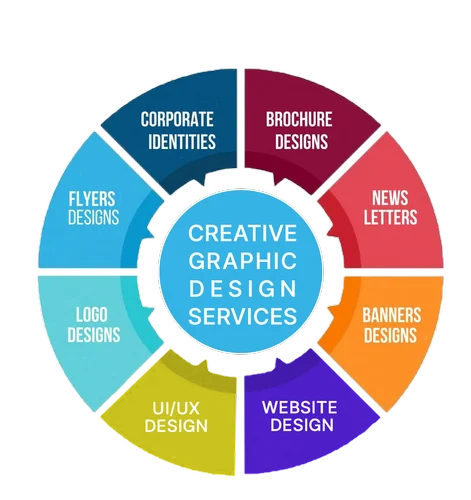
There are many different types of graphics, each with its own purpose and design. Here are some of the most common types:
Charts and Graphs
Charts and graphs are used to display data in a visual format to make it easier to understand. Some common types of charts and graphs include bar charts, line graphs, and pie charts.
Infographics
Infographics are a type of visual representation that combines information, data, and design to create a powerful visual narrative. They are often used in marketing and advertising campaigns.
Maps
Maps are used to visually represent geographic data. They can be used to show the location of important landmarks or to display data about population density or other geographic information.
Logos
Logos are used as a visual representation of a brand or company. They are often designed to be simple and memorable, with the goal of making the brand more recognizable.
The Importance of Graphics
Graphics are an important part of modern communication. They can help to convey complex information quickly and effectively, and they can also help to make information more engaging and memorable.
Attention-Grabbing
Graphics are often used to grab people’s attention. Whether it’s in an advertisement, a social media post, or a website, a well-designed graphic can quickly draw a viewer’s eye and encourage them to engage with the content.
Ease of Understanding
Graphics can make complex information easier to understand. Charts and graphs can help to clarify data, while infographics can break down complex concepts into more manageable pieces of information.
Memorability
Graphics can also help to make information more memorable. Studies have shown that people are more likely to remember information that is presented visually than information that is presented in text form.
Graphic Design Tools
There are many different tools that can be used to create graphics. Here are some of the most popular:
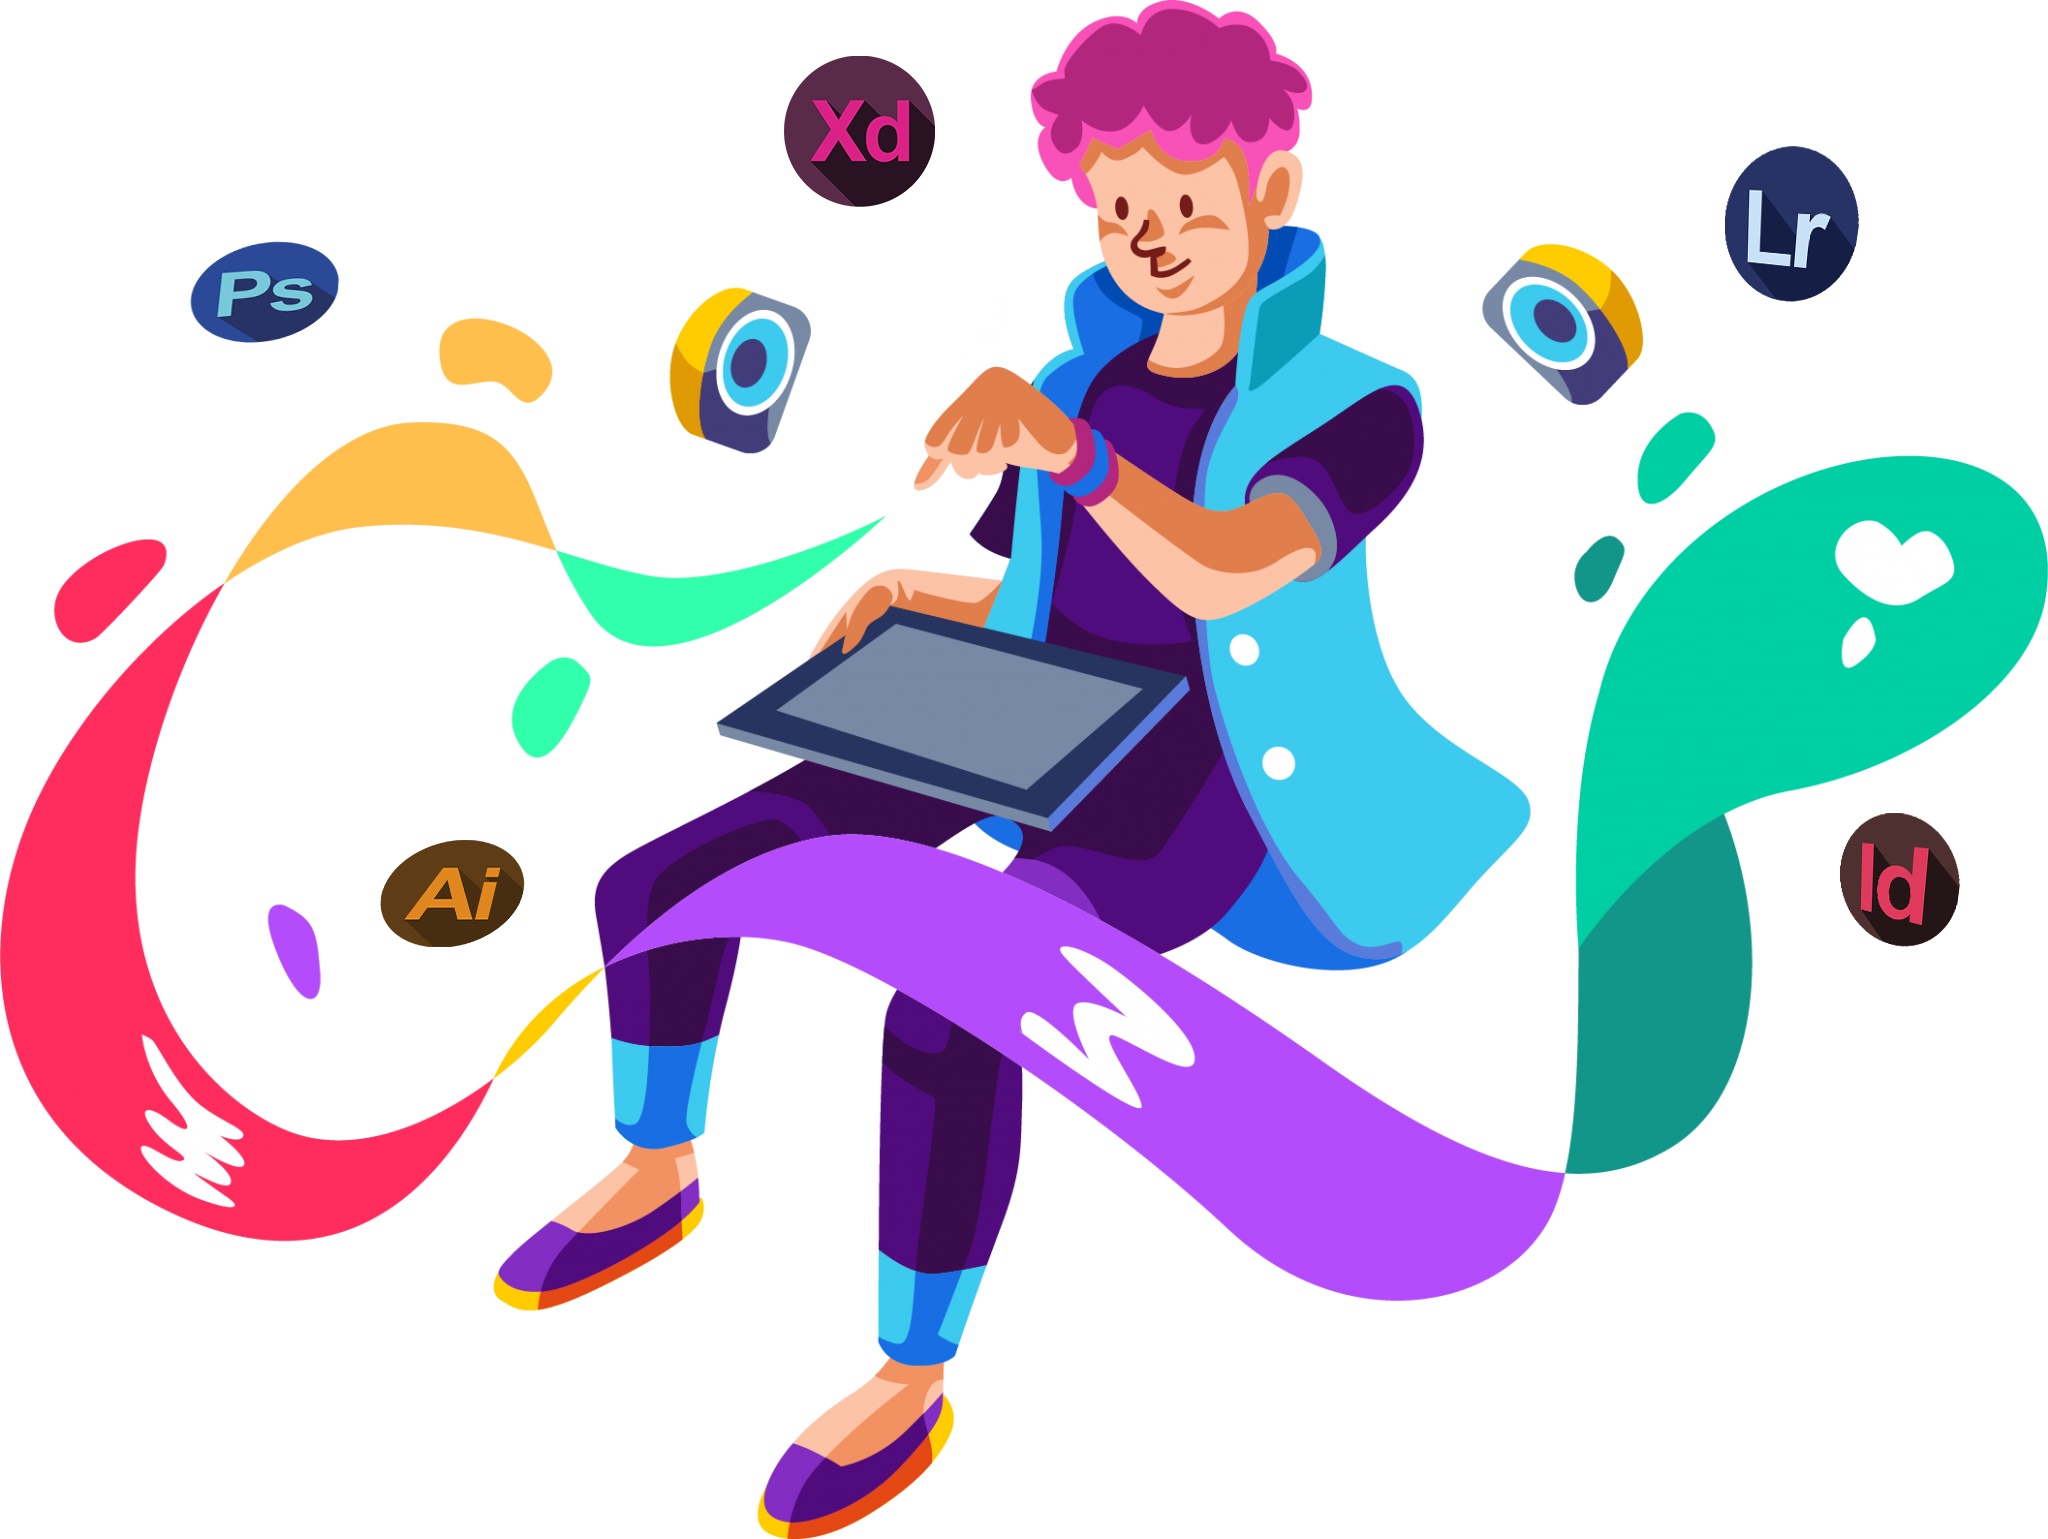
Adobe Creative Cloud
Adobe Creative Cloud is a suite of graphic design tools that includes Photoshop, Illustrator, and InDesign. These tools are used by professional graphic designers and are known for their power and versatility.
Canva
Canva is a free, web-based graphic design tool that is geared towards non-designers. It includes a library of templates and images that can be used to create a wide variety of graphics.
Piktochart
Piktochart is a tool that is specifically designed for creating infographics. It includes a library of visual elements and templates that can be used to create high-quality infographics quickly and easily.
Conclusion
Graphics are an essential part of modern communication. They can help to convey complex information quickly and effectively, and they can also help to make information more engaging and memorable. There are many different types of graphics, each with its own purpose and design. Whether you are a professional graphic designer or a non-designer, there are many tools available that can help you to create high-quality graphics that will grab people’s attention and convey your message effectively.
Download Graphic PNG images transparent gallery
-

- Graphic PNG Picture
Resolution: 800 × 500
Size: 229 KB
Image Format: .png
Download
-

- Graphic PNG

Resolution: 450 × 450
Size: 218 KB
Image Format: .png
Download
-

- Graphic Transparent
Resolution: 501 × 501
Size: 203 KB
Image Format: .png
Download
-

- Graphic
Resolution: 579 × 450
Size: 164 KB
Image Format: .png
Download
-

- Graphic Background PNG
Resolution: 500 × 500
Size: 70 KB
Image Format: .png
Download
-

- Graphic No Background

Resolution: 1178 × 1036
Size: 74 KB
Image Format: .png
Download
-

- Graphic PNG Background

Resolution: 758 × 407
Size: 255 KB
Image Format: .png
Download
-

- Graphic PNG Clipart

Resolution: 1590 × 512
Size: 541 KB
Image Format: .png
Download
-

- Graphic PNG Cutout

Resolution: 423 × 250
Size: 48 KB
Image Format: .png
Download
-

- Graphic PNG File

Resolution: 1000 × 1200
Size: 787 KB
Image Format: .png
Download
-

- Graphic PNG Free Image

Resolution: 763 × 767
Size: 99 KB
Image Format: .png
Download
-

- Graphic PNG HD Image
Resolution: 370 × 450
Size: 183 KB
Image Format: .png
Download
-

- Graphic PNG Image File
Resolution: 2048 × 1539
Size: 759 KB
Image Format: .png
Download
-

- Graphic PNG Image HD

Resolution: 360 × 360
Size: 27 KB
Image Format: .png
Download
-

- Graphic PNG Image

Resolution: 864 × 357
Size: 41 KB
Image Format: .png
Download
-

- Graphic PNG Images HD
Resolution: 471 × 500
Size: 215 KB
Image Format: .png
Download
-

- Graphic PNG Images

Resolution: 200 × 200
Size: 50 KB
Image Format: .png
Download
-

- Graphic PNG Photo

Resolution: 380 × 380
Size: 27 KB
Image Format: .png
Download
-

- Graphic PNG Photos

Resolution: 1920 × 1280
Size: 118 KB
Image Format: .png
Download
-

- Graphic PNG Pic
Resolution: 505 × 368
Size: 205 KB
Image Format: .png
Download